Thursday, July 31, 2008

31/07/2008

Futures analysis
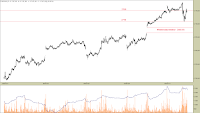
The futures managed to get above January low level of 2680, which happened on rather heavy volume. Wednesday appeared to be very bullish and kept positive sentiment, caused by short term catalyst - early ADP nonfarm payrolls publication. Now that today's news showed, that american economy missed its growth forecast, the volume became even heavier and today's session closed posting a hanging man pattern. This recent price action combined with earlier euphorical buying might indicate, that we are in the middle of a bull trap, which could eventually put an end to current corrective wave. Last time I stated, that if the futures break above January low, then the next upside target will be 2800, now corresponding with declining 100-day moving average. Tomorrow comes out the Labor Department's nonfarm payrolls news, so volatility will probably strike again. Tomorrow's post-news sentiment has to confirm today's selloff, if the market is to terminate the pullback right away. Otherwise, better-than-expected employment data will keep the price in current resistance area, up to 2800.
After continuation pattern on Wednesday (gap and the whole intraday trend), today's price action went mostly sideways, which indicated, that the futures were near an exhaustion level. Late day news on economic growth in America caused a sharp selloff, backed by huge volume. The market managed to recover a bit just minutes before closing, but as you can see on the intraday chart, it was a corrective wave, that found resistance at 2750 (earlier a support level and Wednesday's last hour high before closing). Now, the futures have become range-bound between 2710 and 2750, which will be our pivotal area for the next session, in case that futures change the trend to downside definitely. Staying above the upper level might still revive chances for 2800 retest. On the other hand, if the market breaks down through 2710, the nearest potential support is Wednesday's window of 2665-85. If we take the selloff leg, then add it to last hour's pullback high, then price target appears just at the window level, so it would be a classic 1:1 measured move. The States remained in a downtrend and did not change sentiment before closing, so my stance for tomorrow is bearish. Though, as it has been proven by recent examples, the market could already discount everything overnight and post another downside gap. If a downside gap occurs in the morning, then any bullish price action will be driven by positive expectations on nonfarm payrolls.

Tuesday, July 29, 2008

29/07/2008

Futures analysis
The pullback has slowed down, but managed to stay relatively intact after some overnight sentiment catalysts, that stopped out just minor traders. As you can see on the daily chart, the futures are nearing declining 50-day moving average, which is now corresponding with January low of 2680, creating much stronger potential resistance. Given current market sentiment, this level could be tested tomorrow, because of as little as 20-point gap, that separates the closing price from this area. Tomorrow starts the news streak, which will setup sentiment for the next week. First comes ADP nonfarm employment change, which is slightly less considered sister of actual nonfarm payroll announcement. Then, late in the day, we will learn about Crude Oil inventories, that will influence intermarket action (having in mind oversold Oil futures). Unfortunately for Warsaw Stock Exchange, it is coming out after the closing bell, so any drastic change in sentiment would probably result in an overnight gap next day.
Intraday chart shows, that the futures are struggling to make new highs, although price does not move sideways much. Recent movement has been volatile, which is caused by betting before important news (this explains rapidly changing sentiment and gaps). Today's session was bearish overnight again (just as Monday), turned to strong bullish just after the open but barely made a new high before closing. January low is just 20 points away and completes a resistance area along with the most recent level of 2660. Given today's action in the U.S., my stance for tomorrow is naturally bullish, at least for morning part of the session, before announcements come out. The States posted a strong uptrend, that did not show a reversal pattern before the close, so I would even expect an upside gap on the open here. If the gap exceeds 2680, then look of the price to find support in this area at least to 2660. If it does not prove as a significant level, then the market could have some trouble breaking above it in the future. Remember, that the best confirmations occur when markets post sustained moves (pure volume-backed price action; no windows). If price manages to stay above 2680, then the pullback could extend to even 2800 in the intermediate term.

Sunday, July 27, 2008

27/07/2008

Futures analysis
Dark cloud cover pattern, that formed on Thursday has been rejected by the futures, which indicates that current pullback will continue at least to reach 2680 level (January low on daily chart). Friday's session also closed Wednesday's upside gap. The market managed to gain some momentum again, so we are probably going to see the retest in the beginning of the next week. Notice, that long term 100-day moving average is still far away from the price, so I would not be surprised, if we had same consolidation pattern as after establishing January low (until it retests the MA). Only difference would be in price range, which going to be significantly tighter, than previously (2450-2680). There will be no crucial macroeconomical announcement from America until Thursday (GDP advance). Friday will bring ever-volatility-causing non-farm payrolls data, so unless you are a position trader playing higher timeframes, I would not advice to get involved in the market before the news, because it would be pure gambling.
As you can see on the intraday chart, the futures discounted all bearish sentiment overnight (rules from America) and opened near lower band of Wednesday's window. It was actually the last of selling we had seen that day. Three downside spikes (bear traps), that you can see near the gap level sucked in some remaining sidelined money and prepared the market for upside action. My only concern for not being bullish on Monday is that the market moved parabolically, which often is a good indicator, that it is time to sell. Moreover, Friday was an outside range day, which also is commonly considered as a reversal pattern. On the other hand, the futures keep making new highs, showing some strength and we did not actually see a top formation yet, so only danger here, that would instantly reverse the market is an event of low probability (surprising the crowd). The States moved sideways on Friday, but managed to establish a solid intraday support and bouced off of it. Thus my stance for Monday is bullish, unless the market opens above previous day's highs (above 2650), which would destroy the whole picture.

Thursday, July 24, 2008

24/07/2008

Futures analysis
The futures slowed down today, one day after posting continuation gap. Two last candles align in a pattern, which is called 'dark cloud cover' and is commonly known as a stall/reversal formation, suggesting a possibility to close overnight window from Wednesday. Such occurrence should not surprise anyone. The futures managed to post a five-day rally after downside exhaustion, and now there is room to resolve current situation without sharp, emotional and volatile moves. Yesterday I feared, that housing data from the States might act as a short term bearish catalyst, but I did not expect it to break current price formation. This brings up important points to note:
  • Friday will be crucial, because the market is going to penetrate Wednesday's gap level
  • A sustained move below the gap area will indicate, that retest of 2680 will be much delayed in time and if the market becomes weaker after that, then we will see retest of 2450 first
Tomorrow will only bring us data covering new home sales in the U.S., but the news comes out at 16:00 CET, so it will be near the end of trading session (sentiment for Monday).
Intraday chart shows, that the futures broke rising trendline, that I plotted yesterday. We are out of the main short term trend, so from now on we have to pay attention to support areas, which are certainly going to be retested. Outcome of these retests will tell us, if current pullback in daily timeframe is going to extend or reverse early. Firstly, the gap level between 2580 and 2600 will definitely play a crucial role tomorrow, as it has already been touched by the market minutes before the close. Below this area, there could be a potential support near 2550, which is represented by intraday swing lows (emergency short term support). If the daily pullback is ought to continue, I would like to see the market not testing 2580 from the downside with confirmation. This is because such occurrence would lead to a trend change, meaning early termination of our current correction. In the wake of american stock market's close, it will be really hard task for the futures to remain above the whole window level, unless something happens overnight. The States posted a decline backed by momentum, which did not change even late in the day. According to my rules, if there is a trend before the closing bell, it is likely to continue on the next day and in this particular case (given the magnitude of downtrend), there is possibility of a downside gap in the morning. Resistance levels for tomorrow are: 2620 and 2645, gap level is the main support and emergency area lies near 2550.

Wednesday, July 23, 2008

23/07/2008

Futures analysis
The futures managed to exceed 2600 resistance area, by posting an upside window. The next resistance area is of course January low of 2680 (daily) and there are only 50 points left along the way. Current rally has been very sharp so far, as you can see on the daily chart, which shows how exhausted the market had become earlier, after declining actually from 3000 level. Huge downside momentum caused a V bottom pattern to form and squeezed all the shorts, that entered too late (on bear trap below 2450). I do not know, for how long the markets are going to forget about America's recession and thus, how much strength can current pullbacks gain. Nevertheless, WIG20 futures will remain inside 2450-2680 range in the nearest future. A sustained move above 2680 could lead to retesting even 2800, but that may be an optimistic forecast on my part, considering overall weakness. Tomorrow and Friday will include data on american housing market, which is actually the most relevant in terms of influence on market sentiment.
Tuesday posted a sideway correction pattern, which I expected in my previous analysis. The market managed to preserve its momentum and that resulted with an upside window, today's morning. As about 50% of the move was doscounted overnight, WIG20 futures moved only 30 points to the upside and found daily high between 2600 and 2660, which are now key levels of support and resistance respectively. Given today's price action in the U.S., the market could again act a little neutral on Thursday. The States showed a volatile session, closed positively, but did not form a clear trend either way, which makes it harder to forecast. Though we are still in unbreached uptrend, so the odds are in the bulls' favor. If the futures are to post any sustained moves yet, the best way would be to gain strength by pulling back to this rising trendline, that I plotted on intraday chart. Such price action would discount States' indecision, but also give room to gain strength required to rally further.

Monday, July 21, 2008

21/07/2008

Futures analysis
The pullback continues and it has managed to last three days, which was enough to retrace back almost to 2600 - the last swing high in this downtrend. My stance for today was neutral/bullish, because I was not sure about american stock market's action, due to its yesterday's closing price near two-day resistance. As you can see, throughout practically whole trading session today, the buyers went aggressive and caused the market to post a huge momentum rally, which lasted all the way to the close. You can also see, how market's sentiment can confuse many traders, by rejecting intermarket technical principles. For the whole day, traders were betting along with rebounding Crude Oil, which caused Exxon and other industrial companies to rally before opening bell in the States. As, you can see, the fact that Exxon produces only half of its then-sold petroleum does not concern many players in the market, which sometimes causes such correlated movement between stocks and Crude Oil. Nevertheless, the Oil finally rebounded and it seems, that another session would be an intraday turning point.
Intraday chart shows, that even if the market opens above previous day's highs, it can post a huge 2-percent rally and retest key levels from the last week. The futures managed to get above important swing highs, practically with no looking back. Now let's see, how current situation can evolve. The States posted a decline today, which was a result of arbitrage profit taking from European session. It was a single day today, when every other stock market preceeded America (not the opposite as usual). Trends in S&P and Dow Jones are naturally down, but both of these indices managed to post an intraday double bottom pattern, which could change things here (but not necessarily). My bet for tomorrow is a correction, either sideway flag pattern (if the futures preserve momentum), or more sharp pullback to 2555 or even 2535. These are primary and secondary support areas respectively. Oil is currently rebounding after falling 11%, so we have to wait on the sidelines, in order to see, how current situation is going to develop. The only market, that did not forget inflation are american bonds, which have recently turned bearish again. Oil is the key now, so watch it carefully, because then you will be able to gauge for how long the stock market is going disregard inflationary pressures and how big current pullback may become.

Saturday, July 19, 2008

19/07/2008

Futures analysis
The futures managed to get back above the key long term support area of 2450 by posting a two day sustaied rally. This short term reversal was caused by a huge trend change in Crude Oil, which fell for the last three days, fueling rebounds of global stock markets. The most important factor now, is that the whole pattern in daily timeframe (Crude) indicates important reversal, which will mean, that we are probably going to forget about inflation for the next couple of weeks even. As for WIG20 futures the nearest upside target, if the pullback continues, appears to be near the last swing high of 2600. This is strictly for short term only, I do not know how strong is the market yet, to judge if it is capable of going any further. Hopefully, upcoming week will show us, whether buyers are aggressive enough to drive the futures further upwards. Short term catalysts for Monday are two important announcements from America. First is the ever-volatility-causing Beige Book and New Home Sales, which are expected to be little better than previously. Watch these two carefully, as unexpected data values will probably set short term sentiment for the global stock markets.
As you can see on the intraday chart, the futures gapped up on Thursday and thus confirmed previously defined support area between 2407 and 2417 (check my last post). More important fact here is that price found and confirmed support at the long term 2450 level, which was my primary requirement for an uptrend to begin. Friday was more volatile, as we had indecision in the Crude Oil, that finally collapsed at the end of the day, causing stock markets to post rallies before closing. As for Monday, the nearest support and resistance levels are plotted on the intraday chart to the left. First is of course the last downside window level between 2477 and 2500, which will act as a primary support zone. If the market confirms it and bouncess off, then comes a resistance area between 2525 and 2540, which consists of previously established intraday swing highs and lows. According to my rules, now I should set my stance for the next session, judging by american stock market's close. The last trend in DJIA and S&P500 is to the upside, which is likely to continue, but my concern is, that indexes closed near important two-day resistance, which may still be rejected. My stance thus is neutral/bullish. The futures are above supports, have some room for any potential upside action, but still might remain in a sidetrend until American opens. I would not be surprised, if conclusion came late in the day.

Wednesday, July 16, 2008

16/07/2008

Futures analysis
The futures still remain below main long term resistance of 2450. Though today's session showed little volatility and ended up posting a low-range candle in the daily timeframe. On one hand, there is actually no sign of anything, that I could consider a selling climax, but on the other hand, we have technicals from the global markets. WIG20 futures are in the middle of a significant retest, which happens to align with a top on Crude Oil and maybe a bottom on Dollar. Conclusion is, that the global markets have entered a crucial period, which is to solve short and mid term situation again. The most important short term volatility catalyst is of course earnings reports season, which everybody is paying attention to, especially in the States.
The market has slowed down recently, as you can see on the intraday chart. Today's session went in a bearish/neutral sentiment, which resulted in posting a bear trap below previous day's low of 2417. We have an intraday support now, which has been confirmed and will act as a good reference point for upcoming trading sessions. 2407-17 area became an emergency support level. Now we have to wait and see the result of retesting 2450 from the downside, which will show if the futures are strong enough to go back above it and develop a longer pullback, than previously. I would rather expect an uptrend tomorrow, unless the market gaps up in the morning. The States rallied nicely today and did not show any signs of reversing current trend to downside, so according to my rules, there are greater odds of continuation than reversal and this occurrence is going to be reflected by WIG20 futures here. If the market reaches above 2450, I marked the nearest significant resistance of 2475, which corresponds with yesterday's continuation gap.

Tuesday, July 15, 2008

15/07/2008

Futures analysis
Awaited retest finally occurred today, as the futures posted a downside gap in the morning and declined to reach 2450 area - low of May 2006. It is sort of odd situation, because the market posted actually a continuation gap near the crucial support instead of exhausting itself, which would signal an early short term reversal. Nevertheless, the close lies below 2450, so we have to wait for a confirmation, in order to consider current level a significant pivot point. In the wake of recent market momentum, this could even firstly become a resistance (tested and confirmed from the downside) without stopping/stalling or pulling back. Volume has reached the highest levels since the last week, so it is possible, that the futures are nearing a selling climax. Our benchmark (the States) declined today after previous announcements on Fannie Mae and Freddie Mac, which spurred concerns about economic growth and inflation. It can even get more pesimistic tomorrow, after data on industrial production and core CPI.
Intraday chart shows, that the futures were not strong enough to reach above even previous day's low of 2477. Decline, which started an hour before the noon reached to a support of 2420 - long term level. You can also see, that the market tested 2450 primarily from the downside and later posted a bull trap even, which is not a good forecast for any bulls. 2420 acts as emergency support for tomorrow. Any price action below this point has greater odds for continuation than reversal. 2450 will serve as a pivot point for the next two days, in my opinion, unless the market becomes so weak, that it will be unable to reach back and retest this level. My stance for tomorrow is bearish. American stock market tried to recover today, but eventually posted a double top pattern at resistance marked by previous day's lows and remained in a sharp downtrend all the way to the close. S&P500 futures have 14 more points to retest today's lows and this current move is likely to be continued at least just after opening tomorrow, that is why I think WIG20 futures will follow.

Sunday, July 13, 2008

13/07/2008

Futures analysis
Is that even a pullback? The futures only managed to post a two day rally, after a downside exhaustion gap on Tuesday. More important thing is that the price was not able to reach above both short term moving averages (10- and 20-day), which shows how weak the market has actually become. Only 50 points left before retesting 2450 low of May 2006. Volume has been rising recently, so that may be an early sign of another exhaustion, considering that price is in the vicinity of a key long term support zone. It is a matter of time now, when we retest 2450, so watch this level closely, if you want to get involved in near future. Monday's macroeconomical announcements will cover data from New Zealand and UK, with more importance to exotic far east currencies, so it may have little influence on stock markets in advance. Tuesday and Wednesday will be crucial, as there is going to be whole lot of news along all timezones and this, I think, will determine market sentiment for the rest of the week.
As you can see on intraday chart, the recent two-day pullback ended up with an exhaustion rally on Thursday. The futures posted a double top pattern near the 2580-90 zone and declined sharply, which indicated a huge momentum selloff on Friday. The market managed to recover a bit just minutes before the close, but did not show any clear evidence of buying yet (except volume climax). That means I would advice to wait for at least one higher low above 2490, before even thinking of getting involved on the long side. Key intraday levels for Monday:
  • - 2485-95 support area - the last hour low with double bottom pattern
  • - 2520 resistance - the market has already given itself some room to reach this one
  • - 2540 - in case of a sharp upside rally
The only emergency support level is 2470 area, which is the last low protecting retest of 2450. Friday's session in the States closed in negative territory, but the market managed to recover late in the day and even posted an uptrend, which is more likely to continue than reverse on Monday. Though my stance is neutral, because decline on Friday means decline on Monday, besides the markets start very slow in the beginning of each week, which is natural.

Saturday, July 5, 2008

05/07/2008

Futures analysis
The market does not show any signs of pulling back yet. If you look at the daily chart, you will see that the futures have gained so much momentum, that they cannot manage to reach even the shortest of moving averages (10- and 20-day periods). If you look at the intraday chart, you will see, that there are only side corrections, which do not show any buying evidence. The market continues to get weaker and weaker, until it probably reaches our main downside target, which lies near 2450 (May 2006 low). Basically, global stock markets managed to pass through short term earnings period, which were not actually that bad, but now comes the time for macroeconomics again. We had U.S. Labor Department announcements on Thursday, which indicated, that american economy is actually more important, than interest rates movement in Europe or even the far east. Next week will bring more news, this time about another currency-moving factor - Trade Balance. This is coming out on 11th of July and will determine intermediate term sentiment in global markets.
Three last sessions were rather volatile, as a result of macroeconomical announcements, that came along with exploration of new lows in the futures market. The futures are constantly bouncing on and off only intraday highs and lows, which shows, that there is not really any point of high significance on the way to 2450, where the price could stop for longer period of time. Sideway action is the only thing, that could happen throughout the last couple of weeks and this does not sound very optimistic. As for short term market sentiment, I would expect a neutral/bearish action on Monday. The States did not trade on Friday, because of Independence Day and did not show any strong buying evidence back then, so it would be another 'holiday effect', which happens almost every time. As for WIG20 futures, they closed near the most important of intraday areas - 2517, which will act as another last resort support here on Monday. Below that, there is only Thursday's bull trap support around 2510, which may hold a little. After this level is broken, there will be only 50 points to the long term support zone of 2450, where you could look for a potential short term bottom.