Tuesday, April 29, 2008

29/04/2008

Futures analysis
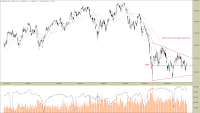
Two declining moving averages (20- and 50-day) today provided enough resistance, to pushed the market back below the middle line of 2890. It was another momentum-driven decline, which confirmed second consecutive lower high in just one week. Now that the futures begin to gain downside momentum, the nearest price target appears to be around 2820 area - the last level of support before retesting lower band of this whole symmetrical triangle pattern. Today, the only announcement from America - consumer confidence, turned out to be worse than expected (fell to five-year low), so this might indicate first signs of betting for tomorrow's potential news-driven market action.
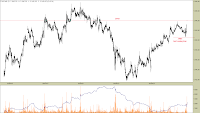
Today's session appeared to be totally bearish (with little neutral action), as a result of intraday trend change to downside in american stock market yesterday. I only picked one price target, because I did not expect the futures to gain such momentum. Although the price stalled for a while at 2875-90 level, the selling pressure managed to accumulate and pushed it further to 2850, which is prior support/resistance area. American stock market closed in the negative territory again, posting another similar intraday trend changing pattern, just as yesterday. According to my rules, such occurrence favors continuation, so naturally I expect 2875-80 level to act as a resistance tomorrow, if it is going to be touched by the market. If current support of 2850 is broken, then the next downside target will be 2820 - the last two-week double bottom.

Monday, April 28, 2008

28/04/2008

Futures analysis
Monday was bullish and it also was the third consecutive upclose day. Although, declining 10-day moving average did not appear to be a tough resistance, the futures are still below 20- and 50-day averages, which are also declining. Naturally, these two closely aligned indicators will act as a potential resistance in the nearest term (next couple of days), if the market is due to go higher. Resistance confirmation at MAs will post another lower high inside the symmetrical triangle pattern, which will mean, that the bears are getting stronger. As for the downside, the middle line will act as a support, as it did a number of times before. It is the end of the month, so there will be numerous macroeconomical announcements, especially from the States, which define the global market sentiment. Tomorrow, we have consumer confidence and on Wednesday employment data, along with all important Fed policy statement. It is not advised to make trades before such events, as it is pure gambling, but these will hopefully act as longer term catalysts.
Two short trends developed today, as WIG20 futures somewhat tried to post a short term top, touching a significant multiple-timeframe resistance level (2940). As for now, I do not think, that tomorrow this market will be capable of getting back to 2980 area, unless there will be a morning upside gap. The reason for such (bearish/neutral) action is that the american indexes changed intraday trend to downside in the second half of the trading session. Price action, that takes place before the close is usually continued the next day. This late decline will in my opinion define tomorrow's session, here in WIG20 futures, preventing sustained upside action above 2940. The rest depends upon overnight movement in USD/JPY, as it is the main factor when it comes to determining future direction of global stock markets. 2980 area remains as a potential upside target in case of moving up and the nearest support level for tomorrow appears to be the last swing low of 2905. If the market breaks down through this area, then it is probably going to stall at 2880-90.

Saturday, April 26, 2008

26/04/2008

Futures analysis
Daily low of 2815 was defended on Thursday, so the market somewhat avoided a sharper decline to retest the lower band of symmetrical triangle, that has been developing over the last few weeks. On Friday, the futures managed to pullback a little and found resistance at the declining 10-day moving average. Current price level corresponds with the middle line of triangle (2890), that I named as a key pivotal point inside this whole pattern. As you can see, it has been tested for a number of times, which only confirms its significance here and indicates mid term market indecision. Although the nearest short term support (2815) is defended, technically we are still in a downtrend in the daily timeframe. As long as the last lower high of April 21st remains unviolated, I cannot consider this double bottom pattern, that formed at 2815 as valid.
Thursday appeared to be a bullish day just as I expected. The futures confirmed a bottom at 2815 and bounced back from there, along with the global markets. Despite one quick decline, this two-day uptrend has maintained its momentum until it reached 2910 yesterday. My bet is that the uptrend is going to continue on Monday, or at least will not change to bearish in one single session (depending on the global markets again). The question is, if the Dollar bounces back further in relation to low-yielding currencies, would the stock markets follow in the same magnitude? As for WIG20, the price has to post a sustained move above 2910, in order to reach further to the upside and retest prior level of 2970. This could be my price target for the upcoming week. The States closed in an intraday uptrend on Friday with no signs of turning back (the market managed to gain much momentum). Usually, when the trend changes in the second half of the day, it is continued on day after that. Technically, the price did not exhaust itself on the upside yet, so you have to be aware of the news catalysts, that could turn the trend to bearish. On Monday, there will be short term bill auctions in the U.S., which are a reliable and most importantly leading indicator of future potential interest rate changes. As for Europe, the only significant announcement appears to be monthly CPI in Switzerland. These are potential catalysts, than can change the short term picture of the stock markets on Monday from what I wrote earlier.

Wednesday, April 23, 2008

23/04/2008

Futures analysis
Three declining moving averages (10-, 20- and 50-day) provided a solid resistance area, so the futures have formed a continuation pattern so far (which I described as one of possible short term scenarios). My downside target for the daily timeframe was the middle line inside symmetrical triangle, but as you can see, the market has recently gained enough momentum to surpass this level and reach lower, short term support area (explained in intraday section of this post). If this level is broken (which actually spreads to 2800 area), then I will expect the futures to retest lower triangle band. It is the most important support zone for the nearest term (not counting previous years' levels), which will be acting as ultimate confirmation not only for the pennant itself, but for long term downtrend as well.
Since the double bull trap, which I mentioned in my previous analysis there has been another decline, but not as sharp as this from 11th of April. The market gained momentum yesterday, but exhausted itself today just minutes before the close, retesting 2820 - previous intraday low from the last week. American indexes posted a 1-2-3 reversal in the middle of today's session, but managed to maintain intraday uptrend late in the day. Although, the market closed rather far from the peak, my stance for tomorrow is bullish/neutral, meaning that I do not expect the most recent support to be immediately broken. As for potential upside targets, the nearest intraday area appears to be near 2850, which is also today's last hour high. If that is broken, then the next target is 2880-90 area.

Sunday, April 20, 2008

20/04/2008

Futures analysis
The pullback continues to develop, as the market managed to get back and retest crossing daily moving averages (10-, 20- and 50-day). The middle line of symmetrical triangle, that I pointed out couple of posts ago has remained defended, but still serves as a key pivotal point for the daily timeframe. Volume is slightly lower, though has not form itself in a clear diminishing manner, which would indicate a typical pullback here, over the last few days. Upcoming week will resolve current situation, as the futures are entering crucial resistance areas (explained below in detail). The most important, decisive factor here is that the price must not confirm resistance at current position, if we are to witness upside intermediate term trend reversal (meaning a breakout above upper triangle band). If the moving averages are confirmed as resistance, then I expect the middle line to be retested.
Throughout the last couple of days, the futures have managed to get back above key intraday resistance area, which lies between 2913 and 2930. In my previous analysis I stated, that if the price manages to pullback that far, then I expect it to retest prior support level 2970-90. As you can see, the market is simultaneously penetrating resistance levels, which align in multiple timeframes (moving averages correspond with intraday points). Now, that this prior intraday support area (2970-90) has been tested from the downside, the next thing to watch is going to be eventual confirmation. You can see, that before the close on Friday, the futures double tested this level, by posting upside spikes. These spikes so far prove to be bull traps, as the price closed below 2970, but not if we take into account the global markets. WIG20 futures always remain under strong influence of american stock market, which closed over 1% to the upside on Friday. Such occurences usually cause overnight gaps, so the market can even skip the whole resistance area and open above 3000. If not, the plan is exactly the same as for daily timeframe:
  • confirmation of 2970-90 resistance completes downtrend continuation pattern
  • sustained move above 2990 will lead to a retest of 3030 at least.

Tuesday, April 15, 2008

15/04/2008

Futures analysis
The market battles near the middle line of symmetrical triangle pattern as I was recently indicating. Two last daily candles are doji and a hammer respectively, confirming a corrective pattern of the most recent sharp decline, that took place on Friday. Current corrective patterns may last probably until the end of this week, as today U.S. stock market finally rebounded, accompanied with massive rally of the Dollar against low yielding currencies. This middle line is now key pivotal point for daily timeframe, in terms of potentially resolving whole pennant formation. From now on, I will closely monitor the volume and open interest, so we can get the idea of whether current price action is just a corrective pattern or longer reversal. If volume continues to diminish as the price increases, then it will become quite clear, that the futures are accumulating momentum before making the next move.
Intraday timeframe shows a clear bottom pattern, that has formed over the last two days. On Monday, we had this final downside leg, that confirmed exhaustion and then, the futures formed a sharp bottom pattern, which was confirmed today just minutes before the close (price has exceeded both intraday highs). Now, there are two obstacles on the way up. First comes 2913-30 resistance zone, which was barely tested late in the day. Secondly, if the price manages to get back above this area, then I will expect 2970-90 zone to be retested. These two zones are separated by just 50 points, so theoretically could be touched in a single trading session. Volume and open interest are the factors, that will determine price action for daily timeframe. The key factors for lower timeframes are obviously two resistance areas, so trading activity should be monitored closely when price tests any of those, in order to gauge market sentiment earlier.

Friday, April 11, 2008

11/04/2008

Futures analysis
Finally a decisive move in the futures, or is it? The sideway price pattern, that has been forming throughout the last couple of days became confirmed today as a lower high. Situation here starts to look more interesting, as this whole consolidation, which started from January low begins to form a symmetrical triangle pattern. But obviously, I cannot consider it as a downtrend continuation until the lower band of this triangle remains intact. As you can see on the daily chart, the market stopped at a prior support level, which is around 2880 and appears to lie near the middle of triangle. This will be our reference point, as movement either way from there will increase the odds for eventual confirmation or rejection of this whole pattern. If this level is defended, it will mean more sideway action and possibly further contraction. If it is broken, then expect the futures to retest lower band of the triangle.
As I pointed out in my last analysis, the odds for today favored bears, as there was intraday trend change in american indexes late in yesterday's session. Though, WIG20 initially gapped up, but opened near previous day's high, which is usually a fade candidate. This morning action again confirmed 3020-45 zone to be important intraday resistance. A fierce decline started from there and managed to surpass another important area, which is the support between 2970 and 2990. The futures gained so much momentum, that there was not any particular point, where the price would start an actual pullback. This is a good example of a sustained move, that I have been talking about in my posts recently, because chances for retesting 2970 from the downside shrinked very quickly because of such sharp decline. It will either take more time, if any retest is going to occur, or this market will become so weak, that it will be incapable of reaching back. Last week's double top pattern is confirmed.

Thursday, April 10, 2008

10/04/2008

Futures analysis
Sideway price action near 3000 remains unresolved as the futures again try to reach below this key psychological level before making a decisive move either way. At this point, we might want to consider this particular pattern as a lower high in relation to a similar pattern, that formed in the second half of February and found resistance at the area between 3125 and 3260. Value of the recent peak is exactly 3084, so unless the futures break above this point, the downtrend will continue to punish any remaining bulls, as a lower high implies weakness in the market. Trade balance and treasury budget data did not appear to put much pressure on the stock markets, as it did in case of currencies and american treasuries, causing some volatility. There has to be another psychological catalyst, that is going to fuel the next move here.
Since my last analysis, the intraday support zone between 2970 and 2990 has been tested twice, as you can see on the intraday chart. Wednesday opened barely near upper band of this area, but eventually, the futures posted a reaction rally after two consecutive days of decline. Today's session has put an end to this rally, by completing a double top pattern near yesterday's high. This led to a sharp decline just minutes away from the open, as the price quickly gained momentum. Now, 3000 appears to be the nearest significant resistance, which could be penetrated even tommorow, because the futures are moving in quite tight contraction range and could break out in any direction, depending on overnight action. American indexes rallied today, but eventually posted a top formation and began to decline from there, so that may put the sellers in control again here in WIG20 futures. Any sustained move below 2970 will confirm double top pattern, that has formed throughout the last week (seen at the top of the chart).

Tuesday, April 8, 2008

08/04/2008

Futures analysis
The market is still under the main long term resistance zone, which lies between 3125 and 3260. Today's session was another decline, which retested 3000 - lower band of resistance area, that I pointed out on 30th of March (shown on daily nearest futures chart). So the price action is developing sideways here and as long as it stays this way, it will indicate, that the current rally is getting weaker and possibly incapable of reaching the declining 100-day moving average. Speaking only in short perspective terms, this recent distribution process in the futures (just above 3000) is a prelude to upcoming major catalysts - trade balance and treasury budget data (10th of April). You can also see, that the volume has significantly diminished, as traders usually reduce their bets and overall activity before such announcements, to avoid getting caught in volatility.
Intraday Monday action went as I expected in my previous analysis. The market did retest the triple top pattern (established on 2nd of April), formed a rounded top and posted a downside leg, which continued overnight, as there was a 15-point window on the open today. Moday's session was confirmed today actually as a bull trap top in relation to resistance zone, that I outlined in my previous analysis (3020-45). Now, if we are to witness further downtrend here, this area has to be confirmed as resistance yet, in case of any rallies. As for potential downside targets, the next area has already been tested and it lies between 2970 and 2990 acting as wider support. If you combine two reversal patterns, that I was writing about - triple top and rounded top - you can see, that their alignment forms a double top in a single week perspective. This indicates how significant the 2970-90 support area appears to be now, as it has become a critical level for the double top confirmation.

Sunday, April 6, 2008

06/04/2008

Futures analysis
The futures have not moved very far since my last analysis. The market is still fighting through major resistance zones as it tries to retrace back to the declining 100-day moving average. Unfortunately, if you want to get involved on the long side in higher timeframes than intraday, you have to be aware, that this whole action since January lows has been developing mostly sideways. That is, current volatility has not changed significantly, which forces traders to take higher risk. America has recovered a little lately, due to a couple of positive macroeconomical data, that changed short term market opinion on expected recession. These recent announcements came along with significant technical signals, as the Dollar became very oversold and commodities posted a long term top. As for WIG20 futures, the more the Dollar will be retracing, then higher the chances are, that they will retest another major resistance area, which is between 3125 and 3260 in alignment with 100-day MA. Watch price action when in that important zone as it will determine time for the next downtrend leg to form.
In the 5-minute timeframe, as you can see, the futures managed to bounce back from 2920 and rallied for two days until forming a triple top pattern just above 3050 on 2nd of April. On Friday, in the wake of better than expected data on non-farm payrolls, the market began to retrace back to 3050, but ended up closing just below intraday resistance zone, which is plotted on the chart. Early days of the next week will probably bring us a retest of this triple top, unless market's opinion is changed by unexpected news. A sustained move above 3050 will indicate more upside action in the nearest future. Also, breaking above 3080 will be a good confirmation, that the price has enough momentum to pull back and retest declining 100-day moving average. Be careful before going long here as current intraday resistance area has to become a support if the market is ought to go higher, that is minimum requirement. A close below 3020 will indicate either that any further upside action will take more time and will be much weaker (sideways) or may fuel even earlier reversal.