Wednesday, October 31, 2007

31/10/2007

Futures analysis
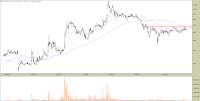
Today was probably the last day of decline in the futures market. Price retested the rising 10-day moving average and considering what happened today in America (Fed lowered the rates by 25 basis points) we are ready to hit new highs. Tommorrow the Warsaw Stock Exchange will be closed due to the All Saints Day, so the market will have a chance to react on this news on friday. Now that the Fed has cut rates, we have one indicator that is left, which will tell us more about future direction in the markets - treasuries. This market has already started to imply inflation concerns and will be discounting it probably until the next FOMC meeting. From now on I will try to post some more information about U.S. debt market, in order to make more accurate predictions.
Today's session posted a typical inverted hammer, which indicates reversal in the trend, so that means the short term pullback has ended. Last two days developed a 45 rectangle, which exactly defined the nearest levels of resistance and support. Above 3945 there is only this historical level of resistance along with recent double top - 3960, 3970 subsequently. That means, there is rather small space to make really rapid and quick moves, unless today positive close in the U.S. will cause an overnight gap in WIG20 futures. Such gap would be third unfilled in a row, which I would definitely consider as a price exhaustion and already start to get more defensive, expecting another short term decline (hopefully finding support at the all-time high).

Tuesday, October 30, 2007

30/10/2007

Futures analysis
Today in the daily timeframe we saw a retest of the rising 10-day moving average, which has been constantly proving to be a solid support level in the short term. Futures market showed a little bit of correction over the last two days and that means, the price has remained safe and sound in a state of being ready to reach the uncharted territory. This two-day decline has developed on very low and yet diminishing volume. The open interest flatted a little, but there is no reason to get short, unless you trade aggressively. This is a typical pullback, which indicates strength of the bulls in a market, because of above factors. There is also possibility, that we are going to see a retest of 20-day moving average, if the decline gets more extended. I am pointing this out, because 20-day MA is lined up with the latest gap support, which for now would really be tough to break (unless Fed decides to leave the rates on current level). Also notice, that the market lately gapped up twice and did not retrace to fill them, so the next gap up in this one might be considered as a sign of price exhaustion.
Today the futures gapped down and continued a decline, that started on monday. The price ended up bouncing off the 61,8% retracement of the whole recent upward channel, that developed from a gap. Considering that american indexes are in the negative territory late in the day, tommorrow session might start from a decline, or even a downside gap. The whole situation is caused by worse-than-expected consumer confidence data, which indicated that Fed may not cut rates on wednesday. So the last day before news we have this indecision going on in the markets. To this moment, a 25bp. hike has already been priced, thus we might expect now, that anything 'worse' than this will fuel further declines in global markets.

Monday, October 29, 2007

29/10/2007

Futures analysis
A record day in the futures. The historical peak equals now 3970 after making a gap on the open today. I don't think anything special is going to happen until wednesday, when the FOMC policy statement is due along with other crucial news including consumer spending. Expectations are for 25 bp. rate hike, so this is definitely priced. The question is: what is going to happen, if the Fed decides not to cut the rates or will lower them by even 50 bp (excluding volatility)? Either way, it is going to be crucial in the longer term for global markets, because soon we will find out if the United States are going into recession or stagflation. As long as the futures remain above moving averages in the daily timeframe, there is little probability of current uptrend to reverse. The open interest is still rising, price is making higher lows, volume is rather stable without frequent spikes, so this market has room to advance.
Today we had a session with little volatility, which is another indicator telling, the market still waits for FOMC announcement. No sharp spikes, no massive amount of money flowing in or out, the price remained in a sidetrend for the whole day. The intraday chart shows main support and resistance levels, that will be crucial in the upcoming days. Main resistance is obviously the new high - 3970, from where I plotted the Fibonacci grid. The nearest support level is 3940, which is prior resistance (retested and confirmed today). If the price stays above this level, then we would get more confident about this pattern not being a bull trap, thus rejecting a potential reversal here. Moreover, a longer consolidation in current 30-point area with rising open interest will make eventual breakout stronger to reach new all-time highs. 3880 has already been tested twice and as long as this market does not reach it again, the main uptrend will remain intact (the more a particular resistance/support level is tested, the more it is likely to fail). 3780 is the emergency level, which means that breaking below it could even mean a double top confirmation and start of a downtrend in this market.

Sunday, October 28, 2007

28/10/2007

Stock candidates

Now, I am going to post some of the stocks, that are about to break out, or just have posted technical patterns, indicating begining or continuation of an uptrend. From now on, I will be posting this weekly trading ideas for stocks, but it will include just a few candidates, due to lack of time.
ATLANTIS has been consolidating in a symmetrical triangle after posting a classic 1-2-3 bottom reversal pattern. This is a situation, which indicates, that an uptrend has started. Now, the only thing needed is obviously a confirmation - the price must break above upper band of triangle, in order to move the stock higher. This is one is liquid enough to establish even larger positions in smaller timeframes. The nearest short term target in case of a breakout is probably around 3,00, which is a prior level of support.
ENERGOPOL might post a classic rectangle reversal pattern, but that will occur only when it breaks above 23,70 (enough for a bottom confirmation). To measure the nearest conservative price target, we must take range of the rectangle and add it to its upper band. That will give us a price of 28,20. Keep track of new money coming in, because the last two candles emerged on higher-than-usual volume, so even if the price finally breaks out, there might be no more support neither in increased trading activity nor any new capital flowing in.
MOSTALPLC is consolidating in an ascending triangle just under the all-time high. On daily chart, we can see that it has been in a huge, strong uptrend for over a year now. The price is constantly making new higher lows, so that confirms buyers are getting more aggressive. Ascending triangle is a continuation pattern, so here we have good opportunity for quite long measured move lasting over 60 points.

Saturday, October 27, 2007

26/10/2007

Futures analysis
Today's session in a daily timeframe posted another doji candle, indicating stall/reversal in the market. Similar patterns were rejected constantly in the past, so there is still a chance, that we are going to break through the all-time high, especially when the price remains above the rising moving averages. As I pointed out in one of my previous analysis, we are witnessing now a situation, which was taking place in the early october. The market plotted reversal candles, such as dark cloud cover, shooting star, doji and still got pass through solid resistance levels. Recently, we have the same behavior in the futures. Key thing to note is that both situations were developing on a rising open interest, which was the main catalyst for squeezing the short holders and skyrocketing the price.
In the morning, the futures finished thursday's decline and adjusted direction of the channel, in which recent consolidation is taking place. Now, the nearest level of support is probably near 3870 and resistance is at 3940 - that defines consolidation range. Beyond that, there is only this historical resistance to be 'taken out' in order to establish a new peak - 3960. The last thing is obviously price target. My bet is for the measured move taken from 3770 to 3940 and added to 3870, which gives us target of 4040. American stocks have bounced off their prior levels of resistance and are now rallying on better-than-expected earnings reports, so that is a good catalyst supporting eventual breakout in WIG20 futures.

Thursday, October 25, 2007

25/10/2007

Futures analysis
The market goes up on reversal candles once again. We had similar situation just before breakout, that led to historical highs - reversal candles making higher lows above rising 10-day moving average. Moreover, the open interest is in an uptrend again, so we have this new flow of money into the market, which I was talking about in my previous posts, so it is a good chance to retest the all-time peak and even to make a breakthrough. American indexes are now finishing their short term pullbacks, which is confirmed by doji and hammer candles near previous resistance levels, that have become support. Factors that will work against this market are:
  • Subprime losses, which are yet to be announced during ongoing earnings reports season
  • Recent concerns about China being 'overheated', that could influence the whole emerging markets sector
In the 5-minute timeframe the market has been rising in a channel. As long as it stays in this sequence of higher lows, eventual breakout above the all-time highs will be stronger, because it will indicate more aggressive buying. Basically, staying above the gap level (3860) will mean that this market is in accumulation stage and about to move higher. Tommorow's open will probably more depend on asian stocks, because of CPI news being released. Movement in the Yen is always a good indicator for the global stock markets (measures the risk aversion).

Wednesday, October 24, 2007

24/10/2007

Futures analysis
The market is nearing its all-time highs again and daily chart posts a hammer candle, which is also an 'inside day' - a typical stall/reversal pattern. Of course we are still above the rising moving averages, but recent weakness in the global markets caused mostly by poor macroeconomical data and earnings reports bring the supply side into business once more. Apparently, the price has to make another higher low, in order to finally get through the final resistance, which means at best we are going to see a flag/rectangle consolidation, but only if WIG20 stays under little less influence from declining foreign indexes. If the situation gets worse, I would bet on yet another retest of 20-day moving average.
Today the market gapped down a little on the open and did not even reach the all-time peak. Short term double bottom is confirmed as long as the price stays above 3860, thus keeping the gap unfilled. Otherwise the market could retest 3770. Considering today's decline in the U.S. (already -185 points on Dow) defending this gap will be really hard for the bulls tommorrow. Moreover, thursday will bring two important news: initial claims and new home sales, both expected to be worse than previously, due to concern about slowing american economy.

Tuesday, October 23, 2007

23/10/2007

Futures analysis
The daily chart indicates that this market is ready to retest its all-time peak. Yesterday confirmed support on rising 20-day moving average and just as I wrote - today we saw a nice mark-up, influenced by positive close of U.S. indexes and fueled by new flow of money into the market (rising open interest). Now, it's just a matter of time for the price to exceed 3960. Moreover, tommorrow starts another streak of important macroeconomical news covering home sales and initial claims in America, which are expected to be lower, thus increasing chances of Fed cutting the rates before end of 2007. That is supposed to prevent U.S. economy from going into recession, so such move will surely drive the stock markets north.
Although the mid and long term look rather bullish, I am not expecting another such extended rally tommorrow just because of one similar pattern shown on the intraday chart. Rectangles indicate this similarity, though only in form, not the size of movement. The last corrective wave in late september ended at 61,8% Fibonacci retracement of prior rally, then posted an upside gap and finally retested the gap level the next day after that. This recent decline has ended almost the same way, but retraced only 50% of prior move. Today we saw a gap and a rally up towards 3940 and a potential retest of gap level is pending right now. Now, we are about to see, if the history does really repeat itself in technical analysis. Remember, that the earnings reports season is still under way, so markets can post gaps or make sharp moves either way, no matter what the technicals are implying.

Monday, October 22, 2007

22/10/2007

Futures analysis
As I expected on friday, today's session was crucial for determining short and mid term direction of this market. So far the moving averages have been proving their significance as support for the price. On a daily chart, we can also see, that the open interest has maintained its sidetrend, which does not imply any aggressive selling going on recently nor massive long exiting. On one hand this indicates, that major uptrend is not likely to reverse yet, but on the other hand, establishing new all-time highs will require significant flow of money in, to fuel the 'mark-up' stage of the next upward move. Basically, the last two candles have managed to stall the price between these two moving averages - 10- and 20-day. We have seen some volatility caused by macroeconomical news and earnings reports, which brought in more trading activity. Is the short term low being developed right now?
Now let's look on the intraday data, so we can have clearer picture of what is currently happening. The market confirmed exactly, what I was expecting - retest of significant support area indicated by 3780 ultimate short term support line and 50% Fibonacci retracement of prior extended rally. Now that my suggested support area has been tested twice, I can say, that the price has posted potential double bottom, which could mean the end of the short term pullback. Moreover, at the end of the day, price violated upper band of this declining channel, that I have been pointing out lately and closed just below another key resistance level that came from 21st of September. Breaking above 3850 will confirm a double bottom reversal and probably lead to another test of the all-time peak. As you can see, the latest price action is influenced by the earnings reports season, so the global markets have become more choppy than usual - forcing traders to take more risk.

Sunday, October 21, 2007

21/10/2007

Stock candidates' performance

Now let's look how did our picks perform last week.
BBIDEVNFI has broken above the symmetrical triangle pattern, after posting a sharp V-bottom and it's currently making a slight pullback, probably to establish support on the rising moving averages. The pullback is developing on diminishing volume, which implies little selling pressure, so I think this stock is ready to retest 2,50 level.
BUDOPOL is still consolidating and testing this resistance near 7,00. Making a higher lows on mediocre trading activity suggests accumulation phase, which is about to drive the price eventually above this resistance level. The nearest target after such breakout is probably near 8,00 (prior resistance/support).
ECARD retested its nearest resistance and the pulled back to form another higher low above the rising 10-day moving average. So far the average has proved to be a strong support in this stock, which is a sign of strength, considering that whe whole triangle pattern is being developed on lower volume than the breakout itself. Staying in such bullish position will lead to a test of still declining 100-day moving average.
FASING is behaving exactly as I have written. Low volume pullback to 100-day moving average proved to be a sign of strength, which eventually drove the price to test its nearest resistance near 36,30. Now if we want to see a retest of the all-time highs, this situation must repeat. So far everything is indicating that this is going to occur, if the price manages to stay above its previous resistance and the averages.
HOOP has broken above its all-time high resistance and so far nothing is going to stop it from leaping higher. The only concern about this one is, that it is kind of a low liquid stock, meaning "no large betsize strategy". The conservative target is about to be reached - it's a matter of 2 points in this one.
HYGIENIKA fell back to retest the moving averages, so it has violated the pennant pattern, which was formed just under the nearest resistance. Breaking below these averages will lead to a retest of the recent lows. But now, let's focus on price making another higher low on diminishing volume, so the bulls still have a chance to drive it above 7,00 if this low remains intact.
INGBSK still keeps to get narrower in this symmetrical triangle pattern, suggesting continuation of prior upward move. Now that it has reached such point of indecision, my bet is that breaking either way from this triangle will define further direction of this stock.
MMPPL looks exactly the same as above, though it's in a different pattern (also suggesting continuation). Breaking either way from the rectangle will drive the price to retest its nearest lows or all-time highs.
PGNIG has stayed above its prior resistance, which I was counting on in my previous analysis. Moreover support is now lined up with rising 10-day moving average, so it's a stronger confirmation of strength in this one. Now, the key is either to remain at current position or at worst decline to 20-day MA and then continue rising from there, if this stock is to maintain its uptrend.
PROKOM is very slow, but it's managed to stay above its recent high (indicated on the chart by figure 2) of this 1-2-3 bottom reversal pattern. As long as it stays above the averages, we can consider this one as a candidate for further advance.
STORMM is still consolidating just under 14,00, so definitely remains on our list. Breaking above this resistance will drive the price to retest 15,50 and then the all-time highs.
TRASINTUR also remained under its short term resistance, so no reason to get involved yet.
WILBO is the one I am concerned about. On thursday it posted a huge shooting star, though on lower than usual volume, so it is definitely a false breakout above 100-day moving average. Then on friday it posted a hanging man, which also implies that the price has stalled. As long as it stays above the averages, there is still a chance to reject this double bull trap.
Now, everything depends on the result of today's elections. If opposition wins, there is a chance, that monday session will not be influenced so much by America's negative close.

Friday, October 19, 2007

19/10/2007

Futures analysis
Today we saw confirmation of the 20-day moving average as the nearest level of short term support. The market retested it and then bounced off late in the day, indicating a little bit of strength. Now, the situation has become more uncertain. Firstly: the latest pullback has developed on constantly increasing volume, which indicates more selling pressure. Secondly: as I'm writing this, the Dow Jones and S&P500 are deep in the negative territory, which means that both have already declined more than 1%. Two key factors coming up for this market on monday: close of the american trading session and sunday elections in Poland.
So far this market has been behaving almost exactly as in the case of previous pullback in late September, which means it is declining in a channel. At the end of today's trading session, the price posted a double test of recent potential turning point in this market, which is the 'derivatives expiration day' resistance/support level. Although we saw two higher lows today, close at the upper band of declining channel does not ensure a downtrend reversal, considering current situation on America's stock exchange. I will not be surprised to see a retest of 3780.
UPDATE: The Dow declined over 360 points on industrial companies' profit outlook, so the elections are probably not going to do any more damage to WIG20, regardless of the result. But such setback puts the 3780 support into 'questionable' state.

Thursday, October 18, 2007

18/10/2007

Futures analysis
Just as I wrote in my earlier analysis, the market pulled back deeper and tested the rising 20-day moving average. Today's data considering initial claims in America indicated a slowing economy. That caused treasuries to rise, because investors are betting on another Fed rate cut. This is the short and mid term catalyst for the global share markets to rise. On the other hand, we will also witness volatility pushing the markets either way, because of this earnings reports period going on right now. The current corrective wave is stopped at the moment, judging by the range of the first pullback after 'Fed move' bottom, seen in late august. These declines are indicated on the chart by rectangles to outline their similar size.
Today's session was a good proof for the 'first 30 minutes rule', that works well especially in the futures markets. The market opened with a little upside gap, then fell below this 23,6% retracement (plotted on the chart) and then found resistance exactly at this Fibonacci level. So the price did not even have a chance to return to its open, which eventually drove this market lower. Just as I expected in my yesterday analysis, the most important level of support appeared to be prior resistance, that is all-important 3780, near 50% retracement. Best bet for now is probably "stall", because of upcoming Sunday elections in Poland. Until now, the politics have not significantly influenced the market (not counting earlier incident in ministry of agriculture, which brought down main indexes slightly), but now everything can happen, considering very aggressive campaigns and overall tension going on. Holding an overnight position until monday will involve more risk than usual.

Wednesday, October 17, 2007

17/10/2007

Futures analysis
Today's session in the daily timeframe posted a hammer candle, which is obviously a sign of stall/reversal, suggesting that this current pullback is to slow down. But on the other hand, the States have already erased all the gains from the morning, caused by some companies' better-than-estimated earnings and that is my major concern, whether this market is going to stop at 10-day MA or not. The Dow and S&P500 are in the negative territory, due to still rising doubts about credit losses. All this is also fueled by slowing american economy (worse housing starts and building permits data) and concerns about inflation. So the futures market stopped out some of the bulls today, but at the end of the trading session, returned back and even exceeded its open just a little bit.
As we look at the intraday data, we can see that the market has found support on prior level of resistance, that I wrote about in my earlier reports, but for some reason I did not mention it yesterday. Prior rectangle pattern has been violated and if the States were to close positively, this could prove to be a solid bear trap, leaving all the strength on the bullish side. As I said earlier, negative close in New York will be a catalyst for the bears, to step into the market again. This would mean retesting today's low and possibly breaking through further to the downside (assuming that we will not witness a gap on the open). The potential range of a corrective wave will also depend on the upcoming news considering initial claims in the U.S. and also the Beige Book. In my opinion, the range is getting narrower, because of important market geometry factors, which are plotted on the intraday chart. Now we have this 38,2% Fibonacci retracement, but more importantly - 3780 level near the 50% retracement, which is marked as the ultimate short term support (because of its significance). Breaking below this would only occur on some serious unexpected macroeconomical data or earnings reports. Watch these levels carefully, as the market will gauge through its psychological states rapidly. This is going to be crucial for determining whether the 'evening star' will be a global trend reversal, or just an indicator for a short term pullback.

Tuesday, October 16, 2007

16/10/2007

Futures analysis
Yesterday very negative session in the United States have brought my thoughts into reality. Today, the market gapped down, closed below the july high level and posted an 'evening star' pattern, which is a typical sign of market reversal. In a daily timeframe the price retraced to its first natural level of support, which is the 10-day moving average. Moreover, concerns about the housing market in America are still being revived, which in the shorter term may be supportive to the bears and cause further pullback. So, the first bearish candle indicating a correction has appeared three days later, than I had expected. If the global markets continue to get weaker, then we would probably see a test of this rising 20-day moving average and later even the rising trendline, which I plotted on a daily chart. These are the key levels of support for this timeframe, with trendline being the strongest (pulling back to it would post third in a row 1:1 correction).
In a 5-minute timeframe, the market has violated its most recent level of support, which was this lower band of rectangle pattern. These potential levels of support, that I pointed out in the first paragraph can be much clearer to see in an intraday chart. 20-day MA value would be probably near the 50% retracement of this prior extended rally, which exceeded the all-time highs. Moreover, this possible support area is nothing else, but prior significant resistance, from which the actual breakthrough had started. This was pointed out in my earlier analysis, but now seems to be coming true. Trendline support (that I can't plot in intraday, but you can compare the charts) would be the 61,8% retracement, also being near to the 3700 gap support level.
Is the long expected pullback finally coming? We are about to see in the upcoming days. The technicals suggest a short term trend reversal, but tommorrow we have this CPI data coming out. I'm not suggesting that it is going to be better than expected, but such news always cause volatility in the markets and might even reject a price reversal pattern, as it did in the previous cases.

Monday, October 15, 2007

15/10/2007

Futures analysis
The flag is forming as I expected, but today's session in a daily timeframe puts me in the alert mode again. Daily candle is a doji star, signaling a stall/reversal in the market. Of course, this pattern can be still rejected, as earlier, but this time we are above july all-time high level. This could get more dangerous if tommorrow's session would be bearish, expecially when the market exceeds friday's low, which would form an 'evening star' pattern. As it says on the chart, the market is approaching a full 1:1 scale measured move from the 3420 low and added to the recent correction. That does not mean, the price is going to fulfill its perfect rally, but indicates that the short and mid term stop losses are just below the flag. Eventual test of the lower flag band may cause a squeeze, with a little help from declining global markets.
The american trading session is bearish at the time of writing, because of Citigroup today's report, reigniting the credit concern. Depending on the close, this situation could cause a downside gap on tommorrow's open. Right now, judging by the intraday data, we have a tripple top situation inside a rectangle/flag pattern. The market remained today above its intraday low, which doesn't mean a reversal yet, but a flattened open interest near the market tops (third day in a row) definitely indicates that the price will have a hard time passing through the resistance level (new flow of money required). So a sharp move below 3880 will be a true test of psychology for some traders.
As you can see, recently we have quite volatile situation in the markets. Problem of subprime mortgages in the United States is surely unsolved yet. Moreover, american investors are concerned about whether the economy is going into recession or not (expecting Fed lowering rates again), because of the declining Dollar and rallying commodities causing inflation. This week has some crucial news considering CPI, housing starts and initial claims in USA. Exiting this turmoil either way, will in my opinion define future of the global bull market (long term).

Sunday, October 14, 2007

14/10/2007

Stock candidates

Now let's look at the charts, to get some trading ideas for upcoming week.
BBIDEVNFI has made a sharp bottom after a major downside move. Now we have an interesting situation, which indicates bullishness in this case. The price is forming a symetrical triangle, which is a continuation pattern after a massive rally on increasing volume (confirmation of mentioned bottom). Now the trading activity is definitely lighter than previously, but this is how the trend develops. Breaking and staying above 2,00 will confirm strength of the bulls.
BUDOPOL is still recovering from the summer decline, but recent price patterns already have indicated, that there is a potential of going higher. We have this rectangle pattern between 5,50 and 6,80 and earlier confirmation of a local bottom (proved by a bear trap). Breaking above the upper rectangle band will give us an upside target of 8,10 - measured by the rectangle's range.
ECARD has finally broken through its recent high, which is a confirmation of a classic 1-2-3 bottom reversal pattern, shown on the chart. Now that previous resistance has become a support, the buyers started to get more aggressive, which can drive the price up to 2,25 in the short term. This is the nearest possible target, indicated by measured move (1-2 wave added to 3).
FASING confirmed 1-2-3 bottom reversal by staying above the prior resistance level. Recently the price pulled back slightly on diminishing volume after reaching the measured move target of 32,85. The situation will get probably more bullish if the buyers manage to drive the price above this recent high. After that, expect to see a retest of the all-time highs.
HOOP is one of the low liquid stocks to trade, nevertheless the price action shows potential for getting above the all-time highs. It posted a significant bear trap, confirming a local bottom, after sharp decline during the summer correction. Since then, the stock has been showing a pattern of higher lows, indicating that the buyers are getting more aggressive. On friday, HOOP retested its all-time highs and I think it is ready to break through this global level of resistance. Conservative upside target will probably be indicated by duplicating the rectangle range.
HYGIENIKA has been consolidating since couple of weeks, but that might be considered as a double bottom pattern, which indicates a reversal of prior downtrend. Now it's formed a pennant just below the local resistance suggesting a continuation. Again, in this case, the conservative price target would be twice the rectangle's range, but only if the price breaks above the upper band.
INGBSK looks similar to BBIDEVNFI. Sharp bottom, a rally, a symetrical triangle - combine these and get a good reason to be involved with a long position. Beware of large betsize, because of low liquidity in this one. Breaking the upper band of triangle will confirm the whole pattern and drive the price up to its all-time highs.
MMPPL also posted a sharp bottom pattern, and it's been recently consolidating in a range. Breaking above the upper rectangle band will give us a conservative target of 13,70 (then goes the measured move).
PGNIG broke above its all-time highs on friday, which occured on an increasing volume after showing a pattern of higher lows. Now I suggest to wait for a pullback, confirming that the price is going to stay above its prior level of resistance. The nearest target will probably be taken by measuring the move from the first low to 5,50 (the last high before the breakthrough) and adding it to the second higher low (shown on the chart).
PROKOM posted 1-2-3 bottom reversal and right now is staying above its prior resistance level. The pullback occurred on a diminishing volume, so there is definitely a potential for going further upwards. My only concern is that the nearest level of resistance will probably be near 150,00 (prior support), which gives a low risk-reward ratio. Pick your timeframe and then get involved if you manage to find RR, that will suit your trading strategy.
STORMM looks similar to HYGIENIKA, although it's formed a bullish flag instead of pennant, which is actually a better confirmation in my experience. Breaking above 14,00 will give us an upside target of 18,00, which is the all-time high.
TRANSINTUR posted a sharp bottom, rallied and formed symetrical triangle, suggesting continuation. Breaking above the upper band of that triangle will give us an upside target of 4,40 (from a measured move).
WILBO - Breaking above 4,50 will confirm 1-2-3 bottom reversal.