Sunday, May 18, 2008

18/05/2008

Futures analysis
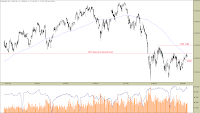
Since my last post, the market has managed to retest long term support/resistance level, which is of course 3070. It also corresponds with still declining 100-day moving average, so we have come to a situation, where there could be an upside breakout (extending current rally), or a rejection of 3070, which will mean long term downtrend continuation. The last two sessions in the daily timeframe showed, that it will take some time yet to gain strength before eventual breakthrough. 3070 so far remains as confirmed resistance level, as Thursday session posted a sharper selloff, that exceeded previous two days' closes. On Friday, the futures declined a little, but the whole trading took place mostly sideways, so you can see on the daily chart, that although we have made a higher low, there has not been any clear evidence of relative strength. As for short term only, there are two price targets in case the market goes either way. The nearest support level appears to be at 2980 and if the futures bounce back from there, then it would indicate strength needed for an upside breakthrough, later on. If the market manages to break above 3070, then the nearest resistance is at 3130, but more important level in my opinion will be the end of first corrective since January decline (3190-3200). This is another level, that will determine long term strength of this market.
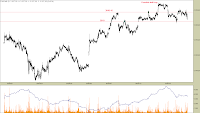
The futures managed to stay outside of 3010-45 range only for a single day, that is Wednesday. Considering price action since then, I can tell, that unless it is rejected - Wednesday's pattern is a bull trap. Now that it has been penetrated a number of times, 3010-45 area will be the main intraday resistance level. If the futures break below 3010, then they will fill the gap from 12th of May and if it does not hold as support, then it will mean a decline to at least 2985-90. But in the wake of Friday's american stock market close, I do not think, that we are going to see a clear violation of current price range. What I mean is that the States managed to recover and even posted an uptrend on Friday, that lasted more than a half of the trading session. According to my rules, price action posted before the close (I measure the market from right to left, to get the idea) is continued on the next day. American stock indexes managed to retrace back to Thursday's close and found it a resistance level, but did not post a clear reversal pattern, that would change intraday trend to downside. My stance for monday is neutral. The only catalysts, that may change market sentiment to bearish on Monday despite the technicals are of course macroeconomical announcements. These will include housing data and consumer sentiment index.

Tuesday, May 13, 2008

13/05/2008

Futures analysis
Finally, a retest of declining 100-day moving average occurred today. As you can see on the daily chart, the price touched it and formed a hanging man candle, indicating a possible short term reversal. This is not unexpected, as the market now has some room to gain strength, if it is ought to go further upwards. The futures have entered the main long term resistance area, which consists of previously mentioned moving average and the level of 3070. Upcoming days will be crucial, because we can see confirmation in both ways (upside or downside) and even false breakouts. So if the market confirms today's hanging man, we will have to wait for a possible higher low to develop, because price can bounce back from there and gain enough momentum to breakthough the main resistance. On the other hand, if we witness a solid break above 3070, provided it will be a sustained volume-supported move, then we must pay close attention to 3070 level, because it should become a support afterwards. The rules are simple - wait until you see a confirmation and then plan you entry. It is always too risky to trade at market's key psychological areas, because it can go both ways on a single catalyst, that changes sentiment.
Yesterday I stated, that I do not expect any breaks above recent intraday highs (3040-45 area in this case), because the U.S. stock market had already discounted data, which considered retailers' earnings and overall performance. Today's session happened to be no other and macroeconomical announcements affected the currencies only. Though, as you can see on the intraday chart, the futures acted different in relation to what I expected. Yesterday's uptrend in american stock market caused an upside gap here in WIG20 contracts, but as they opened near the nearest term highs (3040-45), the price immediately posted a reversal pattern and declined from there until reaching 3015 (yesterday's support). Then, 3015 prove to be solid enough, to keep the market above it at least for one more day. At about 14:00, the futures began to retrace back and managed to retest the resistance of 3040-45, but then posted another reversal pattern. Now, here is the picture of possible upcoming action:
  • The States slightly declined today, remained in the negative territory, but managed to slowly recover in the second half of the trading session
  • Technically, the Dow and S&P have defended two levels of intraday support and closed above them
  • If these factors do not change overnight (watch the currencies), then I do not think, that today's intraday double top pattern in WIG20 futures will be immediatelly confirmed tomorrow (3040-45 resistance)
  • If the futures violate 3015, there is still the gap level of 3000 and prior intraday highs near 2990, that should hold the market in case of highly negative sentiment caused by american stocks

Monday, May 12, 2008

12/05/2008

Futures analysis
The symmetrical triangle pattern has expanded a little bit (former daily lower high no longer serves as a reference point for triangle's upper band, so I had to adjust it), but still remains unviolated despite recent rally. As long as the price remains in current series of higher lows, the odds for a sustained breakout above the triangle are constantly increasing. Current technical alignment indicates, that price level, which violates the triangle will be 3075 from now on, as it is the most significant long term support/resistance area (also corresponding with declining 100-day moving average). Now it is only a matter of days to retest, so if you want to get involved, you should probably trade in the lowest timeframes, as the price fluctuates within just 40 points below the resistance. But, as for the daily timeframe, we must wait now for a confirmation, in order to judge any further market action.
We can see on intraday chart, that 2970-90 area is still acting as a significant pivotal area here in WIG20 futures. It was penetrated yet again on Thursday and Friday and has remained defended since then. The market gapped up in the morning and found support at previous intraday level - 3015, which is Wednesday's swing low and Thursday's swing high. American stock market posted a solid uptrend today, but then again - showed intraday reversal just minutes before the close. Today's announcements showed, that retailers' earnings have surged recently, but now that tomorrow's macroeconomical data covers overall retail sales, it all could be already discounted by the price. What I am expecting here is that uptrend in the States might cause another morning upside gap here in WIG20 futures, but possibly with not enough strength to break through important levels. Late day reversals are usually continued (as in the case of the U.S.) and let this be my market sentiment catalyst for tomorrow. Shortly speaking, I am expecting upside action in the morning, but also trying to anticipate short term tops and reversals at any encountered resistance levels. Unless better-than-estimated macro data will cause yet more euphorical buying, I look forward to see a trend change to downside late in the day tomorrow.

Wednesday, May 7, 2008

07/05/2008

Futures analysis
Four-day rally in the futures stopped today at upper band of the symmetrical triangle pattern, as you can see on daily chart. Declining 100-day moving average has not been reached yet, but is nearing mentioned price band, so it is probably going to act as more solid resistance in the upcoming days. Now we are in a situation, where it could be tough to judge potential future market action. Today's macroeconomical announcements in America greatly influenced the Dollar, bonds and commodities, but hardly affected the stocks, so we have a divergence here, suggesting different sentiment on different markets. My bet is, that the most important indicator is the stock market, regardless of currencies, because trends might change overnight and discount everything that happened after SEC's announcement (though Yen has corrected simultaneously). Although there is some room between the upper triangle band and the moving average, I rather expect the band to be confirmed as resistance tomorrow. American indexes did not change the trend late in the day, so chances are greater, that continuation will occur.
On Tuesday, the futures posted a corrective pattern, but overall momentum did not let the price decline below 2950, let alone 2940, which I expected to act as a direct intraday support level for that day. 2970-90 support/resistance area was penetrated yet again. Today, the futures managed to post a sustained move above this level and remained in an uptrend for the most of the day. My initial upside price target in case of such breakthrough was 3020, but it did not act as a strong resistance (became support later). The second target however (3040) managed to stop the rally and from here I expect a larger reversal pattern to be formed tomorrow (unless there will be overnight gap, which is quite possible). Naturally, 3020-40 becomes a new resistance area and if the market gets stronger in time, then it will probably be acting as violation level for the daily symmetrical triangle pattern. As for the downside, the nearest most significant target appears to be again 2970-90 zone. It has been tested numerous times and proved to be very significant. If that does not hold, then come Tuesday's and Monday's swing lows - 2955 and 2940 respectively.

Monday, May 5, 2008

05/05/2008

Futures analysis
Longer weekend in Poland is over, so we are back on track with new analysis of the stock market futures. Due to holidays there was no trading on Thursday and Friday, so naturally, the nearest session from today appears to be previous week's Wednesday. On that day, the futures posted a doji candle after another sharp seloff and today confirmed a higher low, relative to double bottom pattern at 2820. Now, the market stopped at 2970-90 resistance, which is the area, that I have been outlining since the last three or four weeks. This is the key pivotal level for the daily and intraday timeframes now. Breaking above it will confirm a short term reversal and also set a new upside price target - upper band of the symmetrical triangle pattern. 100-day declining moving average is still far enough from this band to say, that current sideway consolidation will take more time to develop.
Wednesday's session, as seen in 5-minute timeframe, found a bottom near 2850 and then posted an almost flat-sloped uptrend, as traders were probably uncertain of putting larger bets before the long weekend. That day, the Fed reduced benchmark rate again, so taking position before two days of volatility is just too much of risk. The States rose on Thursday and Friday, which was discounted today by WIG20 futures. To make some predictions for tomorrow, there are couple of points to note:
  • American stock indexes declined for the most part of the day, but managed to post a double bottom pattern and changed intraday trend late in the session
  • If this is to be continued tomorrow (meaning that currencies will also change trend against the Dollar overnight), then I expect, that WIG20 futures should not break down through 2940 tomorrow
  • Break above 2990 will set a new upside price targets of 3015 and then 3040