Thursday, January 31, 2008

31/01/2008

Futures analysis
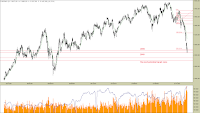
Today's session posted a bearish engulfing pattern in the daily timeframe, confirmed by a large candle, that exceeded previous two lows. The futures market decided to double test resistance zone, which eventually spread from 3030-50 to 3070, so only managed to fill the gap of 16th January. As it can be seen on the daily chart, the market has not enough strength to extend current corrective wave, so yesterday's session proved to be just another bull trap - false breakout signal. For the last six trading sessions, the futures have been consolidating and it can still remain this way unless monday's low is broken (2920). The declining 20-day moving average approaches this 3030-70 resistance area, consistently shrinking potential room for any upside action. If the downtrend continues, then the nearest short term target appears to be the low of 2680, as for the daily timeframe.
5-minute chart shows in detail the range of recent consolidation. Today, the futures retraced back to 2930, which is prior support/resistance area. As the market moves sideways, the open interest has been constantly rising, which means that more money is coming in, thus increasing strength of a potential breakout either way. Yesterday I stated, that if the futures post an upside gap in the morning, then it would probably be a candidate for a short, rather than long position. As the States erased their gains in the end of the day, WIG20 futures opened actually with a downside gap in area of yesterday's highs. Sellers stepped right in from the beginning, which eventually caused short term trend reversal (multiple short term MAs crossover). As long as the price remains below the moving averages, odds for a potential breakout from the range will favor downside. Tommorrow's news covers the most important macroeconomical factor, on which the global markets will gauge condition of american economy - the Nonfarm Payrolls. This is always the most volatility-causing announcement, no matter whether it meets the expectations or not, so judge your risk carefully before entering either side.

Wednesday, January 30, 2008

30/01/2008

Futures analysis
Fed, as expected, cut the benchmark interest rate by 50 basis points to 3% today. As you can see on the charts, this spurred more euphorical buying, which resulted in breaking through 3030-50 resistance zone, here in WIG20 futures. The volume is still diminishing and open interest has flattened, so that may indicate, we could be entering a period of indecision. Conservative upside price target appears to be the March low of 3125 points as it corresponds with another potential resistance, which is the declining 20-day moving average. Again, this is a potential resistance, which does not mean, that the sellers will immediately return when price hits the exact level. Total extent of current pullback will be confirmed by a candle pattern in the daily timeframe and eventual selling evidence in lower timeframes. Fundamental factors remain the same: rate cuts with fiscal stimulus policy increase inflationary pressures, which will mean further weakening of the Dollar and rising commodity prices - alternatively to stock markets.
In the 5-minute timeframe, today's session was basically a sideway price action, which was a sign of indecision - the markets waited for the Federal Reserve. Consolidation took place still below the resistance zone of 3030-50 with double test, but actual breakthrough occurred right before the close. Moreover, this whole action took place on lighter volume, than previous breakthroughs i.e. in the last couple of days, if you look at the intraday data. In other words, it was to weak, to qualify it as a move with sustained price momentum, but until trend does not change to the downside, what I am doing is picking a top. American indexes erased whole 'Fed move' gains at the end of the day, so there is not much left to judge eventual overnight action in WIG20 futures. Eventual upside gap could exceed 3125, but that definitely would be a fade candidate, as it lies in a deeply overbought range. Tommorrow's announcements cover mostly labour market data, so that would be a good short term catalyst to gauge condition of american economy.

Tuesday, January 29, 2008

29/01/2008

Futures analysis
Yesterday I stated, that the futures returned to the downtrend, as daily candle exceeded two previous lows, indicating that more sellers are coming back. Today, the market gapped up in the morning, which shifted the short term trend to the upside and resulted in full retracement of the whole recent downside move from 3030 (including gap fill). Basically we are now having a retest of crucial resistance area, preceeded by a higher low. If the price breaks through this area and maintains its strength, then we would probably have extended pullback towards the declining 20-day moving average, which is nearing another key resistance - March low, 3125. I was recently pointing out, that the whole rally is taking place on light volume, which rather does not indicate any relative strength here (theoretically). However, price is the ultimate indicator, so that higher low may prove to be a good point to initiate more upside action. Again, everything depends on the close of american indexes, as it did especially today. When futures test important price levels, psychology means the most, even when it comes to neglect technical factors.
Yesterday's +1% close of american indexes resulted in an upside gap here in WIG20 futures, which confirmed short term trend change. The global markets are still betting, that expected rate cut by the Fed will spur growth in american economy. This may be a short term catalyst, that may cause stock markets to post longer rallies and it probably will act as such. The question remains: how the interbank rates are going to behave in relation to their nominal counterparts? Because, higher market borrowing cost may slow down economic growth anyway, so I would rather look at the results of recent fiscal stimulus policy. As you can see, the second rate cut may finally be 'noticed' by the markets, resulting in further upside action. As for WIG20 futures, looking at the intraday timeframe, the closest price target appears to be previously mentioned 3030-50 resistance zone. Price showed some buying evidence today, as it remained above the short term moving averages for the whole session. As I said earlier - there has to be a sustained move above this resistance area, if we are to see intermediate trend reversal.

Monday, January 28, 2008

28/01/2008

Futures analysis
Back to the downtrend. The futures did not manage to break through declining 10-day moving average and additionally confirmed previous hammer candle, thus indicating the end of the long-awaited pullback. Today's price close has broken two previous days' lows, which implies more selling again. The whole daily pattern, that began to form after gap from 3070 has not turned in a sharp bottom so far and will remain unconfirmed until the price breaches through 3030 with no bull traps. Now, the most significant price target in the daily timeframe appears to be 2700 again. Apparently, recent rate cut by the Fed was barely noticed by the global markets, as well as by WIG20 here. Sharp correction, that we recently witnessed, developed on diminishing volume, which is still declining, so that would be another sign of weakness driving this market more to the downside.
The futures posted a 70-point downside gap on the open and basically remained in a sidetrend for the whole trading session. As the crucial swing high of 2950 was breached to the upside by an overnight gap, it failed today in exactly the same way and its level will be acting as a resistance from now as it did today. Lower band of the price channel lies near 2925, which is prior level of support, that has been established throughout the recent emotional mayhem in the markets (volatile days). Buying evidence, that I was recently pointing out, turned into selling evidence, as the moving averages crossed to the downside, causing failure of a triangle, that I indicated in my previous analysis. Still, the States are trading for rate cut again, resulting in nearly 1% gain by the major indexes so far. Now, we have to wait, in order to know the market's opinion on the second cut. Fundamentally, more rate cuts mean more inflationary pressures, but psychologically, the markets may shift in the short term.

Friday, January 25, 2008

25/01/2008

Futures analysis
Today's candle in the daily timeframe is not actually a hammer, due to its body size in relation to shadow, but as it is posted just next to the key resistance level, it could mean, that the pullback may be getting exhausted. The reason for pullback extension is that the whole retracement took place in the same time as the last leg, which was posted after gap from 3070. The futures also made another higher low today, contracting the price near key turning point for a potential breakout. On the other hand, we have more reasons to see continuation of current mid term decline. Firstly, today's high reached for the declining 10-day moving average, which acted as a resistance already. Secondly, this moving average corresponds with geometrical resistance, that is: 38,2% Fibonacci retracement. Thirdly, american stock indexes are in the negative territory at the time of writing, so that would be another catalyst for bear market to continue. Bouncing of this current resistance would mean further market weakness and will probably lead to retest the low of 22nd January.
The whole two-day contraction range has established between previous swing high of 2950 and resistance level near 3030. Recently I was expecting, that if the price breaks through the last swing high, it would go back up to 3050, thus increasing probability of entirely filling a gap (15th January). As you can see on the 5-minute chart, there is still some buying evidence, which keeps the price above the 100-period moving average (somewhat dynamic trendline). The futures formed a pattern of a symmetrical triangle, which in the wake of prior swing being made to the upside, indicates possibility of going higher. Though, open interest and volume have been constantly declining throughout the last days, during pullback. This is the last reason for decline continuation. Typically, when markets rally or decline, they are supported with incoming new money. Low volume corrections indicate only profit taking and set up possible entry points for those who anticipate next move in the same direction. If the 100-period moving average gets tested again and again, it is more likely to fail, than to act as support.

Thursday, January 24, 2008

24/01/2008

Futures analysis
After two wide ranging days, volatility suddenly stepped off the market and as a result, we have a small doji candle, barely touching 10-day moving average, which is lined up with 38,2% Fibonacci retracement of the whole decline. The futures gapped up in the morning, influenced by american indexes' yesterday close. Today's better-than-expected job data in the U.S. definitely works as a catalyst now, which could extend this developing short term pullback. Though we are still below more significant geometrical levels, so that does not necessarily mean buyside comeback anyhow. As long as the futures stay below even this closest retracement level of 38,2%, it would rather indicate, that the market is weakening, thus causing this long-anticipated pullback to fail (unless price forms a flag or consecutive higher lows pattern before breaking 38,2%). The situation might get worse in terms of macroeconomical factors, as Cleveland Fed gathered new data from the Chicago Board Of Trade, covering implied probability of further rate cuts in America (link). Option traders are betting, that Fed will reduce the funds rate to 3.00, thus by 50 basis points.
Yesterday I stated, that if the price manages to get above its last swing high (2950), then it would reach back to 3050, which is the nearest most significant level of short term resistance. That did not obviously happen, as we had an upside gap in the morning (open above the last swing high), which apparently exhausted the buyers, also causing volatility to drop for this session. As a result, the price remained range-bound for the whole day between 2950 and 3005 with little trading activity. As the main resistance zone, that I pointed out in my yesterday analysis was totally skipped by the gap, it now may be considered as the first potential support zone, in case of pulling back again (range between 2890 and 2950). There is a chance, that if the States close positively today, this prior resistance area might not be tested tommorrow yet, but later in the upcoming days, as stock markets abroad drive higher and higher (pure psychological factor).

Wednesday, January 23, 2008

23/01/2008

Futures analysis
Volatility is the main part of the bottoming process, so we had another wide ranging day today in WIG20 futures. Although daily candle is not a typical hammer, this long downside spike was a result of buying, which took place late in the session (explained in intraday section of the post). Also we have short term trend reversals in major pairs with the Japanese Yen, indicating return of the appetite for risk, driving stock markets to the upside again. Daily chart shows short and mid term potential resistance areas/upside targets, that are previous important turning points additionally corresponding with Fibonacci retracements (plotted on the chart). As it appears, if the price goes back above the 38,2% retracement, there would be two resistance zones remaining, until it returns to the downtrend. 50% and 61,8% retracements are swing trader's potential reversal points, as often market's opinion changes when approaching these key geometrical levels. 'Potential' means, that there is no 100% probability, that the price will bounce off of one of them, with no looking back or failure, but these are rather zones to pay attention to.
Intraday chart shows how the buyers came back late in the day, which was caused by the open in America. As the price continues to form a bottom, recent intraday action also lines up properly with Fibonacci retracements, while the buyers consistently try to regain the lost ground. Buying evidence, that I was recently looking for was tested yet again today, as the futures fell below 100-period moving average to eventually find support at 61,8% Fibonacci retracement of the latest upswing, which started the whole bottoming process. Now, as the global markets finally retrace back to previously broken support levels, I am expecting a pullback at least to 3050, if price breaches the swing high of 2950, then come the daily targets. Tommorrow's macroeconomical announcements from the States cover Initial Claims, New Home Sales and Crude Inventories, always acting as catalysts, causing volatility and determining the market's opinion on condition of american economy. Although fundamental factors are known for the long term, I always mention upcoming news, because it influences short term emotional state of the markets, which determines potential range of such pullbacks, as we are recently witnessing.

Tuesday, January 22, 2008

22/01/2008

Futures analysis
Today was a special session, because Fed acted on emergency and lowered the benchmark rate by 75 basis points. This move as expected, caused short term euphorical buying and could further cause the long awaited pullback here, in WIG20 futures. In the morning, the market posted a huge 130-point gap to the downside as a result of yesterday's global panicky selloffs. The gap appeared to be in the potential support zone, which I pointed out recently. This retest of 2700 now marks another significant turning point for this market in terms of pure technical factors. Today's close reached up to 2880, which is the lower band of previous support area retested last week. This price range will now be acting as a potential rectangle in upcoming days, defining support and resistance levels, if we are going to see only a side correction. Nonetheless, today we had a wide ranging day and if the price comes back above 2880, then there would be room even to get back and retest March lows of 3120 in the longer term. Volume has been consistently rising throughout the last five sessions, so there is more potential of finally confirming at least a short term bottom here in the futures.
Just after the open, we saw the end of recent quick selling, which resulted in actual bear trap, that soaked some sidelined money in finally putting an end to this extended decline. Again, the whole action, that took place late in the day, was a reaction to Fed's move, so if you consider previous buying evidence failures, then even getting back above 100-period moving average may not ultimately stand for a confirmation, that a bottom has finally established. Moreover, judging by the 5-minute chart, we can get the idea of how important and widespread is the resistance area, that the futures have to break, if this whole pullback is ought to be extended. As long as futures stay above this longer term MA and also post a pattern of higher lows, then it will mean, that the buyside is gaining strength, which will open up some chances for showing some more upside action. The States are also trying to regain the lost ground, but major indexes are still one percent below the previous closes, at the time of writing.

Monday, January 21, 2008

21/01/2008

Futures analysis
Overnight gaps are the main factors, that could deny price patterns in just one session. This is what exactly happened today. Yesterday, in my analysis I still maintained my 'reversal' view of the market, which was caused by a 3-day pattern, consisting of candles with long downside shadows. Also, 5-minute timeframe showed some evidence of buying, but as you probably saw - price action was mostly sideways and as it appeared today, did not show any strength of the buyside. The market weakened to a degree, where it cannot even retrace back to the declining 10-day moving average, thus all the short term signals, indicating a potential short term reversal were denied today. The geometrical support zone, that corresponded with 261,8% Fibonacci projection of a prior upswing was broken and price ended up, touching 2840, which is also previous support. The volume and open interest are still in climatic ranges, making the situation more 'two-foldish', than it actually could be. On one hand, new money, that comes into the market, definitely supports the short side. On the other hand, increased volatility, with new volume highs are indicating, that the market breadth may have reached its oversold climax too, meaning that the supply side itself, cannot provide a sustained move with no pullbacks. Generally speaking, this whole recent selloff is a good example, that price patterns often mean nothing, when it comes to pure market sentiment and also - how hard is to pick a bottom, especially in longer timeframes.
As for intraday timeframe, the whole previous buying evidence, that i pointed out yesterday ended up just as a flat, sideway correction. The futures again opened by posting a downside 90-point gap. As you can see on the chart, prior bull traps, have turned into resistance levels, which was confirmed during the day. The States did not trade today, because of Martin Luther King Day, so tomorrow's session will be the main catalyst for the global markets' next move. As long as the price remains below the intraday moving averages, there is no reason to get long again, fighting the downtrend. Still, we have people holding money in mutual funds. Not all of them have withdrawn their money yet, but they are the major selling force, driving the prices down, so that may explain such extended downside action with no pullbacks here.

Sunday, January 20, 2008

20/01/2008

Futures analysis
The last two sessions posted more downside spikes, thus validating the Doji candle, which appeared on Wednesday in the daily timeframe. As for the geometrical levels, the price ended up its 13-day decline exactly at 261,8% Fibonacci projection of previous upswing, that corresponds with prior support/resistance level - 2890. Finally, the futures stalled at least for a couple of days and maybe we will see a pullback at least to 3130, which appears to be the closest most important area of resistance. Recent information on fiscal stimulus policy in the U.S. was supposed to cool panicky selling in the global markets and it worked so far. Though, as you probably know, injecting another 150$ bln into the economy will cause even more inflationary pressures, which does not change my long term bearish view of this market in any way. If 3130 is breached, then I think the pullback might reach to retest even August lows, which correspond with 161,8% retracement of the same upswing as before.
5-minute chart shows, that evidence of buying, which I pointed out on Wednesday, was confirmed actually on Friday. Thursday posted a retest of the most recent intraday lows and ended up posting another bear trap (plotted on the chart), what more accurately confirms recent short term reversal. The price moves still mostly sideways though. This shows, that the buyers are still fighting to get back and drive the price back up to some more significant resistance areas, so the recent action here in WIG20 futures is caused mostly by exiting short side traders. As for potential upside targets, that emerge from intraday data, the nearest appears to be the close of 15th January. Reaching this level will entirely fill the 90-point downside gap, that eventually (now I can say this having advantage of the hindsight) indicated price exhaustion. 10 days remaining to Fed most probably cutting rates by 50 basis points, so it will be probably the best time to get into the market on the short side and ride the long term downtrend.

Wednesday, January 16, 2008

16/01/2008

Futures analysis
Volume at climax, open interest at climax, downside gap with a Doji bar - does that finally mean, we are going to have a bottom in the futures? This was the 13th straight day of decline, which did not post any pullbacks (as seen on the daily chart). The price has broken through three most important psychological levels and today ended up finding support at the 261,8% Fibonacci projection of previous upswing, before the actual selloff had started. Technicals confirm, that we have entered a bear market and now, after posting such huge decline, the question remains: is the market oversold enough to post at least a continuation pattern? Climatic volume and open interest with increased volatility theoretically indicate such possibility, but before entering the market, one should wait for a confirmation of today's Doji candle. One way is to look at the 5-minute timeframe.
The 5-minute timeframe shows some evidence of buying, late in the day, so it may be a good indicator, which would finally imply a bottom forming process. Firstly, after posting a 90-point downside gap, the futures moved mostly sideways, but with rather sharp moves in both ways. Intraday support of 2930 was then retested and the price formed another bottom, trapping some bears this time and finally finding room for reversal. I also left the moving averages in the intraday chart, to point out this action as an evidence of buying. As it now can be seen, these averages are pointing upwards except for the longest, which is the 100-period MA. So far, the futures have formed this pattern of higher highs and higher lows, which combined with crossed MAs confirms at least this short term bottom. Today's data covering CPI, Industrial Production and Capacity Utilization did not deviate from the expectations, so that would be another catalyst, which may cool market emotions. Tommorrow, the housing market data is coming up, so that will definitely form a short term picture for the global markets.

Tuesday, January 15, 2008

15/01/2008

Futures analysis
Today we had another huge selloff in the WIG20 futures and another example, why market does not care what I think. Though it is quite unusual situation, where we have price breaking through important psychological levels after making an extended decline with no pullbacks. Apparently the global markets gained momentum too, which was caused by poor american companies' earnings and most importantly - worse than expected Retail Sales data, indicating that holiday season did not help retailers at all and spurring more recession concerns again. As you can see on the daily chart, through the last five trading sessions, the market was declining actually on reversal candles, which means, that it formed hammers or posted downside spikes, theoretically indicating at least a slowdown. Those price patterns however did not prove to be valid, because we have not seen any upside action in daily timeframe (not even breaking previous day's high). The last thing to mention is that the open interest has reached new highs, which combined with the rising volume, could mean new short positions being opened (as long term double top pattern has been confirmed). Now, the most crucial catalyst for the markets will of course be the upcoming Fed policy announcement. Fundamentally, it does not make any sense to lower the interest rates even by 50 basis points, as interbank rates are almost a percentage point higher. Secondly, such policy puts even more inflationary pressures (rising commodity prices), causing further declines of the Dollar followed by stock markets.
As for the 5-minute timeframe, yesterday I was anticipating a pullback, which supposed to be supported by rebouding american stock market. The price only managed to retest the lower band of the main declining channel from the downside, but poor Citigroup earnings along with weak macroeconomic data caused global markets to drop rapidly. In the wake of increased volatility, it seems that the nearest upside targets (in case of market finally finding a bottom) appear to be the broken support levels in the daily timeframe (March and August lows). As for the short term, probably the closest level of some significance is the lower band of today's sideway price range (plotted on the intraday chart) - 3170 area. Tommorrow, except CPI data, comes of course the Beige Book, which is a report on condition of american economy. Though it is announced on 14:00 ET, so eventual action here on Warsaw Stock Exchange will take place overnight.

Monday, January 14, 2008

14/01/2008

Futures analysis
The market proved me wrong again and decided to decline even quicker, than I previously anticipated. Moreover, the futures posted fifth in a row downside spike, again indicating price reversal. Though, as you can see on the daily chart, a confirmation is needed - at least exceeding previous day's high, to prove particular pattern valid. Today's candle closed as a hammer with resistance at the August low level and as for the downside - price reached two measured move targets (plotted on the chart as MM1 and MM2). These targets are obviously below the August low, but yet above the next closest support area. In terms of interpreting the price close itself, we have entered the bear market, but in terms of broader technical analysis, this could still turn into a bear trap, if the hammer candle is confirmed.
Intraday chart shows the whole extended decline, which drove the price all the way below the August low. In fact, there are very few situations, where such action happens, because prices do not usually break through important levels after posting such extended rallies or declines. I was expecting at least a lower high, before the breakdown, but it seems now, that the price might end up finding a resistance at this prior crucial support. The main channel, which bound the price for the whole move was lately violated to the downside, which is the main reason supporting my 'oversold view'. Another channel started to develop from thursday and today's session confirmed it by retesting its lower and upper band. The States are finally recovering at the time of writing, so there might be a possibility of a pullback tommorrow (or even an upside morning gap). This week will bring the most important data, which is to gauge the condition of american economy: PPI, CPI, production and capacity, retail sales, housing starts and building permits. All of this combined, is going to be a major catalyst determining longer term direction of the global markets. As for the short term - more betting on upcoming Fed decision, that is going to cause volatility.

Saturday, January 12, 2008

12/01/2008

Futures analysis
Thursday trading session proved me wrong and led to retest the lower band of support zone between 3260 and 3315, exceeding the wednesday low, which I thought was indicating a reversal (strong buying late in the day). On thursday, we had a large volume selloff, which finally caused a retest of the August lows. Friday session led to even more downside action, that resulted in posting one more lower low, but eventually the bulls came back and managed to retrace some of the primary move (explained later in the intraday section of this post). In the daily timeframe, friday session posted a Doji candle with fourth in a row downside spike, proving that the support area held as it was meant to do. Such situation could mean perfect time for a short term pullback, because recently, traders started betting for the Fed to radically cut the rates, in order to prevent recession, but increasing inflation. Radical cut means, that Fed funds rate may reach 3,75% or even 3,50% as indicated by the Cleveland Fed survey.
5-minute timeframe shows, that the price deviated from the channel, that I plotted some time ago. As it can be seen on the intraday chart, the futures violated lower band of the channel, then quickly returned and found support at it again, moving mostly sideways until the end of the day. In the wake of upcoming events and indications provided by daily timeframe, this friday action may now be considered as a bear trap, which could be a starting point of a trend reversal pattern. On the other hand, friday session in America closed over 1% in the negative territory, which could fuel more panicky selling on monday, or even an overnight downside gap. So, if we do not see price moving at least sideways, this whole reversal setup would be for nothing, regardless of the Fed anticipation. No doubt, there is going to be a lot of volatility in the global markets again.

Wednesday, January 9, 2008

09/01/2008

Futures analysis
Yesterday I was expecting, that the slowing futures will pull back more, before finally retesting and breaking through the December lows, but american indexes fell late in the day and caused declines of the global markets. Today's open in America was rather good, so as a result of this, we have another hammer candle in the daily timeframe, though ranging more widely in relation to previous two hammers. The price touched upper band of support zone, which I pointed out yesterday, in my analysis, but came back late in the day, eventually closing in the range of December lows. States are moving mostly sideways at the time of writing, but with more selling pressure now, so that does not imply any reversal yet, here in WIG20 futures. Though a retesting of important levels always means that the crowd is shifting through emotional states, causing volatile price action, which happened today. But until this support zone remains unconfirmed, there is still possibility to move in both ways.
As for the 5-minute timeframe, the price still moves in a declining channel, touching only its lower band, which either means more selling pressure coming into the market or even price exhaustion, creating a possibility to finally establish a bottom. As I often say in my posts, my view comes primarily from the price action, then the catalysts (reaction to news), so my bet is still for reversal/short term bottom and will remain such, until the price stops posting downside spikes. This may continue or change tommorrow, because of important news covering data from the U.S. labour market and also crude inventories, which will determine inflationary pressures and condition of american economy.

Tuesday, January 8, 2008

08/01/2008

Futures analysis
The futures are still slowing down, which resulted in posting a hammer candle in daily timeframe. Today's volume was the biggest since the last nine trading sessions, which may indicate that bottoming process is taking place. Technicals are indicating one thing, but this time, potential catalysts (mostly news) are showing different situation, which makes it hard to judge, where the market is going to move. However, price is the only thing that pays, so if there are no overnight, unexpected gaps, my bet would still remain for more sideway action in the upcoming days. The States are also moving sideways at the time of writing, although there was some speculation on bankrupcy of the lending institutions.
Looking at the intraday data, today's action shows exactly, what I expected yesterday. Sideway action (channel inside the channel) slowed down declining futures, which eventually posted a pullback, reaching 3420 as suggested resistance area. The upper band of the inside channel became support late in the day, followed by a huge downside spike, which was the result of America's open. 3420 remains as the short term resistance along with the declining upper band of the main channel, increasing the significance of eventual retest (whether it is going to be a turning point or not). Macroeconomical data in the U.S. (Pending Home Sales) showed even more slump in the real estate market, spurring concerns again about recession, which is to spread on the global markets.

Monday, January 7, 2008

07/01/2008

Futures analysis
Only 40 points left before retesting December and 110 to August lows. Today's session posted an inverted hammer, which is a sign that the hard selloff may be slowing down and indeed this is a typical situation when markets come to important psychological levels. This may also imply, that before breaking down below the lows will be preceeded by posting another lower high by the price, increasing the strength of eventual breakdown (extended rallies or declines often fail to break important levels at the first 'try'). The nearest support after December lows is of course 3265, which is the low established after 'Fed move' (the rate cut) in the late August. If that fails (confirming the double top pattern), then there is another support zone, which may be the first downside price target, as for the short term. Nonetheless, price action below 3265 would confirm, that we have entered a bear market.
5-minute timeframe shows, that today's price action was mostly sideways, indicating that the declining market may be slowing down. What it appears to be now, is that we have a channel inside a channel. Today's channel has little less downslope and it has developed near the lower band of the main declining channel. Sideway action near important levels of support or resistance definitely suggests a slowdown (but not yet a reversal), so there is still a chance to see a pullback, creating opportunity to get into the downtrend before the market finally breaks down. The nearest eventual upside target appears to be prior support of 3420, which was tested a couple of times before, confirming its short term significance. Unless the market gaps up tommorrow, this appears to be the closest entry point for the selling force, then comes the declining upper band of main channel.

Saturday, January 5, 2008

05/01/2008

Futures analysis
Friday's session confirmed the resistance area, that I pointed out in my previous analysis. This zone lies between prior level of support 3460 and its upper band is 23,6% Fibonacci retracement of the whole latest decline. It was quite volatile day, because of major catalysts, that influenced the global markets. Yesterday's news covered Nonfarm Payrolls, which appeared to be a lot worse than expected (causing recession speculation again) and also, remaining data from the labour market in America (Unemployment Rate also exceeded expectations). Now, that the futures firstly posted a lower high on 27th of December, then confirmed previously mentioned resistance area, retest of December lows appears to be inevitable in upcoming week. 50-day moving average crossed below the 100-day MA on friday, which is a result of poor condition of american economy, that is going to spread all over the global markets. Breaking below the plotted (yet) rising trendline will only leave us the august spike to retest, before confirming the bear market here.
Intraday data shows, that the price is recently declining in a channel, though - as it can be seen on the chart - not perfectly. If you look at the previous analysis, the upper band of this channel is now adjusted in relation to prior position. This is, because the futures acted just as I expected, violating previous upper line and finding resistance at 3495. After confirming this level, the price started to decline a little, but until the news announcement, action was mostly sideways. Eventually, WIG20 futures closed below previous level of support, which is 3420 and will probably move more to the downside, because of highly negative close in the United States. Just 60 points are left to retest the lows established on 18th and 19th of December. How fast the retest will occur is going to depend on accuracy of the channel, that I plotted (especially its lower band).

Thursday, January 3, 2008

03/01/2008

Futures analysis
Today's session opened with a 14-point downside gap and closed just 0,35% above yesterday's gravestone doji's low, showing signs of weak recovery after three consecutive days of declining. The price still remains below 23,6% Fibonacci retracement of the whole 3-month downtrend and has entered a short term resistance area, which will prove to be crucial probably tommorrow already. Confirming this area will mean faster retest of the December lows, but staying above it may produce a short term reversal pattern. Such action will definitely slow the upcoming retest, but I do not think, that it would be capable of ending the whole downtrend, in the wake of recent macroeconomical concerns. My focus is on whether December lows are going to hold as a support or not. If that happens, the double top pattern (July and October) will be confirmed.
5-minute timeframe shows, that today's action was mostly sideways, with no spectacular reactions even on the news. The nearest resistance lies probably near the declining trendline, but this will depend on the overnight action, that could drive the price more to the upside, eventually finding resistance near 3490 (plotted on the chart). But as you can see, this is still a projection of potential price action. A 5-wave decline found its end today at 3420 support and the market has still a chance for reaching more to the upside. As I am writing this, the Dow futures climbed only 0,26%, so the odds, that there will be an upside gap on tommorrow's open are reduced. Couple of news coming up also, including the most volatility-causing Nonfarm Payrolls and the rest from the labour market.

Wednesday, January 2, 2008

02/01/2008

Futures analysis
Happy New Year everybody, we are back from the holidays and ready to hit the markets again. But the beginning of 2008 brings us some bad news, driving global stock markets lower and lower again. Crude oil hit 100$ a barrell today, gold hit 860$, soybeans and wheat climbed more than 3%, which indicates, that major players are hedging against inflationary pressures in America. Moreover, Fed is expected to lower rates again, which is to prevent recession, but as we know, increasing money supply will spur more inflationary concerns. As you can see on the daily chart, today's candle looks like some sort of a downside doji cross, which indicates much selling pressure in the futures (explained later, in intraday section of this post). After posting a shooting star near the declining 20-day moving average, the market continues to decline second day in a row and will probably retest 18/19th December lows.
Lot of volatility going on in the market today, which was the result of today's action in commodities. On the open, the futures reacted to a selloff, that took place on 28th of December. Price pulled back, reached 50% Fibonacci retracement of the recent downside move and eventually posted a bull trap barely touching previous support/resistance level of 3532 (marked on the chart). Then, the sellers came in and drove the price back to its open, posting a huge 40-point gap on the close. Tommorrow's action depends now on the close in the United States. Dow Jones futures are declining almost 2% now, two and a half hours before the close. Also, some news coming up late in the day - Initial Claims and Factory Orders, which are to determine condition of american economy.