Sunday, December 23, 2007

23/12/2007

Futures analysis
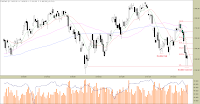
After posting a double hammer pattern, on thursday and friday the futures formed a double inverted hammer pattern, which eventually generated a small pullback towards declining 10-day moving average (daily chart). Friday was the derivatives expiration day, so from now on, we will be looking at march series. Last week brought us some important news, that was considered as stronger catalyst for the global markets. Firstly, consumer spending in the United States rose more than expected, decreasing odds for recession. Secondly, European Central Bank injected 500 bln USD into the interbank market, which fueled short term rallies in the global markets. My stance remains unchanged. For the first time in history, central banks try to save the economies from the results of credit crunch by increasing money supply, thus generating inflationary pressures. These are short term activities, which are to cool market psychology, preventing rapid declines or even crashes of the stock markets. Fundamental factors are still supporting longer term downtrends.
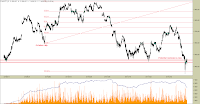
Looking at the intraday chart, we can see, that WIG20 futures posted a 4-wave pullback, which ended up finding resistance at 23,6% Fibonacci retracement of the whole mid term decline, corresponding with 38,2% level of the last sharp, downside move. We are currently entering holiday period, so I do not expect much of volatility in the global markets. Breaking above 3500 will mean, that current pullback is going to be extended at least to 50% Fibonacci retracement, which appears to be the nearest upside target. 3510 is a former support level and it lies just before this retracement, creating a potential resistance area. On the intraday chart I also plotted a downtrend line, which is also acting as a resistance in the short term, so if current pullback is meant to be extended, the price must break through these levels on heavy volume, in order to confirm a reversal.

Wednesday, December 19, 2007

19/12/2007

Futures analysis
Another hammer was developed today in the daily timeframe, which indicates a potential short term reversal in the futures market. Two long downside shadows, combined with sharply declining open interest are a sign, that the remaining buyside traders have been stopped out and the supply is getting exhausted after four straight days of decline. 3440-50 still remains as major resistance zone for the short term price action. 10- and 20-day moving averages crossed over again, but considering how far are they from the price, it is quite fair to anticipate a greater pullback as the market entered deeply oversold range. 3440-50 area also corresponds with 23,6% Fibonacci retracement, which will make this level more significant (today's high established exactly at this retracement).
Intraday timeframe shows, that the futures did not actually retrace back to yesterday's low and made a higher low, implying quicker reversal. 3440-50 resistance is now the nearest upside price target. Returning above this area will trigger next most probable resistance point, which corresponds with 38,2% Fibonacci retracement of current decline. If the price does not return above 3440-50, then I would expect much quicker retest of the august lows. Combined with increasing open interest, such situation would definitely imply, that new money is coming into the market, supporting the short side, eventually extending downtrend in the longer term.

Tuesday, December 18, 2007

18/12/2007

Futures analysis
Yesterday I anticipated a corrective wave, that would hold the price above 3440 before returning into downtrend. Today, the market proved me wrong and decided to violate this significant support area. Daily candle formed a hammer at the end of the day, so that long downside shadow (see the chart) indicates a potential slowdown in this declining market. The problem is, that price remained below prior lows (double bottom) and 3440-50 area should be considered as a potential resistance zone now. The open interest declined the most in the last four days, which in this case implies massive long exiting or rather stopping out of the buyside traders. Unless the futures stay below 3440-50, this whole situation could develop into a bear trap as the market entered deeply oversold range, but this is an optimistic short term scenario. More probable in my opinion is a retest of the august lows.
In the 15-minute timeframe we can see that today's downside price target was actually a 161,8% Fibonacci projection of October rally, which ended up with a double top reversal pattern. Here, it can be seen more clearly, that what we had today, was a complete sell-off, finally exhausting downside price action. Now, that the States have closed in positive territory, the price is more likely to stall in currrent range between 161,8% projection and 3440-50 resistance area. Depending on overnight action in the far east markets, it may even retrace back above this level, delaying further declines. The key factor is now the macroeconomics. European Central Bank injected money again into the interbank market, cooling panicy selloffs, that took place lately. But now, what matters most, is a moment, in which the market's opinion on situation of lending institutions (subprime crisis results) will change to such extent, that it will sustain in the bear mode for longer period of time.

Monday, December 17, 2007

17/12/2007

Futures analysis
The futures retraced back to 3450 support level, which previously was the foundation of double bottom pattern. Last time I stated, that breaking confirmation level for this double bottom will indicate more selling pressure, alerting that return to bear market is possible. Of course, retest does not mean immediate breakdown, especially after such extended downside move. As the market closed near to the key psychological level, everything will now depend on overnight action, fueled by stock market in America, which is again in deeply negative territory. Secondly, such move could have already been priced in advance, so there is still a chance to see WIG20 oscillating around this key support level tommorrow.
As we can see on the intraday chart, the head and shoulders pattern, that I pointed out a couple of days ago, was confirmed, but market action got so extended, that the price greatly exceeded its estimated target. Eventually, this led to a full retracement of prior 5-wave rally. Today's high and low marked again important previous support and resistance levels. The price is now in a contraction zone between 3450 and 3540. This contraction range happens to be the same size as the nearest corrective wave in this decline (marked by rectangles), which will work as a breaking force of further downside action in the short term. If the market stays on tommorrow's open in this zone, my bet would be for a correction, at least to retrace back to the upper band of this range. Breaking below 3450 and then 3440 will signal that the bear market is gaining strength.

Thursday, December 13, 2007

13/12/2007

Futures analysis
Returning back into the bear market. The futures did not manage to get above 50- and 100-day moving average, in spite of lower interest rates in America, which are supposed to save the global markets too. Double bottom pattern will be tested yet again. Firstly, getting below 3610-15 area, will put this market into alert mode, and then getting below 3440 will indicate definitive continuation of a downtrend. Now, it appears, that Fed's decision did not help at all, because interbank market has already discounted borrowing rates as higher than their nominal value, so the market cost of money is still rising. As for the daily timeframe, if the market stays above its nearest short term support (which is plotted on the chart) near 3610, then there would be a chance to defend the uptrend. Otherwise the bears will be back in control.
Intraday data puts on a very interesting short term picture of the futures market. The latest price action looks exactly as it comes from Elliott wave principles. The initial rally consisted of five waves, ended up on monday and today, we saw the final leg of three-wave correction, which found support at 38,2% retracement of the whole rally. This retracement happened to come along with 50% Fibonacci level of a move, that was taken after the first wave, as it can be seen on the 15-minute chart. Another thing worth noticing is a potential head and shoulders pattern, which has developed in the area between 3640 and 3760. The neckline was violated today and the futures pulled back to it, confirming, that it is a level of resistance now. If the market continues to decline, downside target appears to be near 3540 area.

Tuesday, December 11, 2007

11/12/2007

Futures analysis
Today's session in the daily timeframe ended up putting the price in a congestion zone between two longer term moving averages - 50- and 100-day. This is a natural reaction to an extended rally, that took place lately and lasted for almost two weeks. Those last two daily candles are lined up in a pattern, that is called a dark cloud cover and indicates price stall or reversal. In this case, I am only talking about a short term reversal, because of major catalyst, driving this market up, which was the Fed anticipation of course (to this day). Now, that the market indicates a potential correction, there are two significant support levels, that can hold the price in bullish mode, depending on the size of eventual pullback. First is the most recent 3670, which is now alligned with 100-day moving average, second is of course 3610-15 area, alligned with the latest double bottom pattern.
As I am writing this, the Fed cut benchmark interest rate by a quarter point, which immediately caused speculation, that it will not improve economical situation. This is a good example on how the market can turn on just one catalyst, which I expected quite some time ago. The inflationary pressures are too high and Federal Reserve has little room to maneuver left. But let's look at the 15-minute chart. Here we can see, that the rally has finally ended, finishing a three-leg corrective wave, which brought the price back to crucial 3700. As this was a five-wave short term uptrend, now in the wake of a catalyst (Fed's decision) I expect to see a failure of this rally and probably retracement to previously mentioned support levels in the daily timeframe. Only returning back above 3700 will open a chance for the bulls to step back in.

Monday, December 10, 2007

10/12/2007

Futures analysis
Scenario for the daily timeframe did not work for today and the futures rallied up to 50-day moving average, rejecting this double hammer pattern, which I described yesterday. There was not any particular news during the day, so nothing was holding back the bulls while driving up the price. Now, the daily timeframe looks good in one way. After a double top, that caused sharp decline from historical highs to 3440, the futures posted a rounded bottom pattern, which of course means returning to the uptrend, at least in short term. The key is, that the markets have already discounted tommorrow's decision of Fed to lower the interest rates and now it is time to judge, what is going to happen next. WIG20 futures approached significant geometrical turning points. Firstly, the price remains in somewhat a congestion area between the moving averages. Secondly, it is about to approach a major long term resistance, which is a significant psychological turning point (as seen in the past, on daily chart). Moreover it is close to 61,8% Fibonacci retracement of the recent decline, which will be definitely supportive for the selling force. The final point to make is my overall bias is for the bulls in the short term, because the last thing that matters here is the rounded bottom pattern, which determined current rally until the market posts another reversal formation.
15-minute chart shows exactly, why the daily scenario (double hammer reversal) did not work. As I wrote yesterday, the futures formed a narrowing triangle pattern, which indicated, that current rally will continue. The price did not fall back to 3610, as I was pointing that as a possibility, in case of fulfilling the daily scenario. As I pointed out, we are currently in the stage of developing the fifth wave in this rally. Although the selling took place late in the day, this last correction is not yet considered as a failure. The price must retrace back below 3700 at least to indicate, that the whole upward move is over. In the intraday chart, it can be seen, that there is another congestion zone in the futures, that is little narrower, than primary area in daily timeframe and has clearly defined support and resistance levels. Tommorrow is the FOMC policy announcement, so if there is going to be a 25bp cut, nothing would really happen as such move has already been priced. The most crucial question is: how far can american economy go, inflating its way out of the mortgage crisis.

Sunday, December 9, 2007

09/12/2007

Futures analysis
After a huge rally, that confirmed double bottom pattern in daily timeframe, the futures posted two hammer candles, indicating a stall, caused by profit taking (declining open interest). As for now, I consider this latest rally as a three-leg typical correction of a downtrend. The price retraced back to declining 100-day moving average and stalled there, indicating that further upside movement may occur only if the bulls manage to drive it above 3700, which is the main level of resistance currently. Depending on the market's reaction on Fed's decision, this whole price pattern, that is below 100-day moving average may eventually develop into a rounded bottom, indicating a major, more significant reversal and return to the uptrend. Not only it depends on the interest rates in America, but in Poland there are recently expectations that Rada Polityki Pieniężnej will increase the rates three times until February. These are the two most important factors for the long term now.
15-minute timeframe shows a different short term picture, than daily chart. Here, these two hammers are shown as a narrowing triangle, which is of course a corrective pattern, but indicating trend continuation. Moreover, this pattern formed just under this major resistance, that is 3700, so I consider this situation as somewhat a turning point for this market in the upcoming week. This recent rally consists of four waves, considering that this triangle pattern will not be violated to the downside (will remain as a continuation pattern, which it is currently). If I am correct and the price goes above 3700, there would be only one more wave left to put an end to this rally (based on Elliott wave theory). If the futures fail to go back above 3700, there is still a chance to retrace back to 3610 and confirm former resistance as a support there. The most crucial reason, to put this market back to uptrend is that it must remain in this current pattern of higher lows at least. Breaking below the lower band of narrowing triangle will eventually lead to retest 3610 and breaking below there will lead to retest 3520 and then 3440.

Wednesday, December 5, 2007

05/12/2007

Futures analysis
A huge rally occurred today, driving the futures back up to the declining 100-day moving average. The double bottom pattern, that I was writing about couple of days ago has been confirmed by today's price action, so we have a short term trend reversal here in WIG20. Futures retraced practically the whole move from 3700, thus the last uncleared gap in this current decline. And if the bulls manage to drive the price above this level, there might be chances, that we will not end up in a bear market here. That would be forecast for the mid and longer terms, but in the short term I think we should focus on particular levels of support, which are plotted on the daily chart (3670 and 3610). These are the key levels, which I expect to be defended, if we are ought to return into uptrend again. Otherwise, this double bottom pattern will be for nothing.
The first support near 3670 is probably more likely to be breached, just when any profit taking occurs, so it will probably be tested intraday, but also could prove to be less significant in higher timeframes. That is because its position next to today's close, which is not far from there. As it can be seen on the intraday chart, the last three-day action was basically a rally, 50% retracement (described yesterday) and another upward leg, that ended up finishing a measured move in scale of 1:1 (lines plotted on the chart). It is a typical ABC correction, but the thing is, it should not remain as such, if we are to witness a reversal in this market. Important news coming up also and these are the most volatility-causing: Initial claims (tommorrow), nonfarm payrolls, unemployment, sentiment and consumer credit (all on friday), so the last-minute indicators, to judge Fed's move in advance.

Tuesday, December 4, 2007

04/12/2007

Futures analysis
The futures bounced off from the declining 10- and 20-day moving averages, but the price has pretty much remained steady in the same area over the past few days. Moreover, mentioned averages are about to make a crossover, so recently we are witnessing indecision in the market. Even there is not much of volatility now - the markets are waiting for Fed's decision, which is coming up on 11th of December. As for strict technicals, in the daily timeframe, the futures made a higher low in relation to price action from 28th of November. That means, the buyers have not given up yet and started betting for a rate cut beyond the ocean. As I wrote in one of my previous posts, this is what I expect from the markets in the short term. If Fed cuts the rates, it may cause short term reversals in declining stock markets, but in my opinion, this will not last for long. Euphoric buying will be just natural reaction to major catalyst, which is such event, but clearly the rest lays in fundamentals. Lower rates will further weaken the dollar and simultaneously drive commodity prices upward, eventually causing recession in America and a slump in stock markets.
Basically, what was happening over the last two days, was that this market formed a short term bottom, which put an end to a wave, correcting last week's 3450-3600 rally. Price firstly tested the 50% Fibonacci retracement, which is the natural and most common level of support in terms of swing trading. Then, today in the morning, the futures posted a bear trap just below this retracement, bounced off of prior support and rallied, to eventually form a bullish engulfing pattern, by retracing the whole monday's move. One only thing, that concerns me, whether the price is going to retest the latest high (3620) is today's close in the U.S., which is slightly negative. This always has influence on morning price action in WIG20, but I do not completely neglect possibility of retesting 3620 tommorrow or day after that.

Friday, November 30, 2007

30/11/2007

Futures analysis
Two hammers have been posted by the futures, indicating a strong selling pressure, which holds the price below 3600. In fact, this double hammer pattern confirms, that current downtrend is not going to reverse yet, so another pullback ended up touching declining 20-day moving average - short term level of resistance. As long as this market stays in current area between 3600 and 3440, such situation prevents this potential double bottom pattern (marked on the chart) to actually form and reverse this downtrend. Now, the futures remain in a sidetrend, which signals waiting for Fed's decision, to solve this twofold situation. Breaking above 3600 will confirm a double bottom reversal, and breaking below 3440 will confirm a rectangle, which is continuation pattern. These are the key psychological short term levels for this market.
The last two-day action was a retest of key short term resistance level, that ended up being the upper band of a possible rectangle pattern in this market. The price has been consolidating in this previously developed range, and as I said earlier, so far there has not been any confirmation of going either way, so we have to wait until price breaks through 3600 or 3440 as shown on the 5-minute chart. The resistance area lays between 3605 and 3620 and today, the price touched its lower band, which established a lower high here, indicating selling aggressiveness. Preventing the price to retest 3440 again is the only level of support, that is plotted above the middle of rectangle - 3555. American indexes have erased their morning gains, so I do not expect any rapid or sharp price action on monday.

Wednesday, November 28, 2007

28/11/2007

Futures analysis
As it turned out, euphoric buying took place late in today's trading session, which defended short term support area of 3430-50, but the futures closed just at declining 10-day moving average. The global markets totally ignore weak macroeconomical data, coming out from the United States and as a result, we have another rally in the Dow and S&P500, fueled by financial stocks. Now, we can see that what is currently going on is pure short term speculation based on emotional responses to just one or two daily facts. Moreover, there is still a possibility, that the crowd, which is shifting through its emotional states, could drive our WIG20 back to the uptrend. That may occur, because today's price action has established a double bottom pattern in the daily timeframe, which is confirmed if the bulls manage to push this market above 3610 level.
Today's session started with an upside gap, which I expected yesterday. The price retested 3440, which is the longer term level of support and a crucial market point, from where the initial rally had started (and led to establish new historical highs). So now, the whole movement has been retraced by the market. Trading activity emerged after retesting the support and the bulls regained strength, that drove the price back to another short term resistance level, that is 3555. Now, we are facing exactly the same situation as couple of days ago. This could evolve into a double bottom pattern, if the futures manage to get back above 3555 and then reject prior bull trap at 3600. Further from there, it will be safe to say, that trend reversal is coming.

Tuesday, November 27, 2007

27/11/2007

Futures analysis
As I was expecting yesterday, the price retested its nearest short term support, which is 3450 obviously and is now entering a key psychological support area in the daily timeframe. As recent pullback appeared to be very weak, the overall measured move got extended and shows a new longer term downside target for the futures. The previous measured move indicated a retest of the august lows (taken from 3960 to 3550 and subtracted from this 3-day mid November pullback, that had occurred before the latest correction). Now, if I take the whole move from 3960 to 3450 and subtract it from 3615, it will give us price target of 3105 (assuming, that this market will not form a double bottom right here at 3450 and reverse, which is still possible).
In the 5-minute timeframe, today's price action was just a continuation of previous movement, that took place on monday. The upper trendline, that I plotted on intraday chart will now act as a resistance, while the futures are declining in this pattern of lower highs. As for tommorrow's open, there could be some euphoric buying, caused by today's unexpected announcement of Abu Dhabi Investments 'injecting' money into Citigroup. This event was a catalyst for a rally in american stocks and may drive up the WIG20 futures also, as it usually happens after such increases. The investors did not even care about weak macroeconomical data about falling housing prices and - most importantly - consumer confidence. Tommorrow is the Beige Book report coming out, so definitely there is going to be a lot of volatility in the markets until the week ends.

Monday, November 26, 2007

26/11/2007

Futures analysis
The futures are still in bearish mode and have only managed to reach the declining 10-day moving average, which shows that the buying force is not going to regain strength at least for now. Today's candle in the daily timeframe in alignment with two previous days, has formed a huge bearish engulfing pattern, that drove the close even below thursday's open. This whole recent pullback developed on a declining volume, so in my opinion, the market is poised to decline further. Open interest bouced off just a little and if the price goes below 3450, it would mean that new money supports the short side rather.
Intraday data shows recent price action in more detail and it can be seen, that the futures market has retested some important geometrical levels. I thought, that getting above 3600 would bring more bulls and give reason to get long at least in the short term, but this whole movement appeared to be to weak and everything above 3600 has become a bull trap. Recent volatility caused the price action to be more choppy than usual, so if I was to pick a short term support level, I would still go for 3460-50 area, because of numerous short term lows of lower significance on the way down. Upcoming announcements in America will cover very important data on consumer factors and housing, along with the Beige Book report, so definitely volatility will hit the markets again. My expectations remain the same as before - recession in the U.S. and retest of the august lows.

Thursday, November 22, 2007

22/11/2007

Futures analysis
The market finally pulled back to 10-day moving average in the daily timeframe, regardless of what I expected yesterday. Global stocks rebounded, which fueled today's reaction in WIG20 futures. Open interest is still rising and supports this recent pattern on higher lows, indicating more aggressive buying. The 20-day moving average has recently crossed below 50-day MA and is about to cross the 100-day average, confirming prior bearish price action. Still, price movement does not show any signs of reversal, except for the short term. The nearest news from America is coming on 27th of November, so until then the global markets will mostly depend on less significant data from other countries and technicals, which would make my forecasts more accurate.
The 3550-75 resistance zone, that I pointed out a couple of days ago has expanded to 3595. The futures stopped there and closed, extending 5-day rally, which confirmed short term bottom near 3450 area. Today, the stock exchange in America is closed, due to Thanksgiving, so tommorrow we are going to find out, if our futures are strong enough to get above 3600. Definitely, this 3550-3600 area has become a turning point in this market and any reaction either way will define future direction for the price, so it will determine whether this latest action is going to become a bottom, or continuation pattern. As for the global markets, the key is now level of consumption and housing market development in the U.S., because these are the only factors that will save this country from getting into recession and stock indices from the bears. As I said earlier - neither action from the Fed is going to turn up the stock markets.

Wednesday, November 21, 2007

21/11/2007

Futures analysis
After a wide-ranging-day the market posted an inside bar, which was a natural reaction to yesterday's positive close in America. But low volatility so far confirms, that what has been happening over the last four days is probably going to end up as just a flat correction in this downtrend. Today's announcement about initial claims in the U.S. met the expectations, so we did not witness any sharp moves as earlier. Open interest bounced up a bit, but new money has not managed to drive this market up even to declining 10-day moving average yet, implying more short term weakness. As for tommorrow, the odds are with sellers and I expect another decline, maybe to retest 3450 again. This would probably be driven by today's downside action of american indexes (S&P500 erasing year's gain).
Although intraday action looks rather good (price making higher lows up to retest the main resistance area) I do not think, that there will be any reason to get above 3575, unless something unexpected happens (i.e. overnight news). Basically, today's price movement was mostly sideways, finishing just a quick rally to at least partially fill morning gap. Now that the market has posted just a flat correction, it leaves definitely more room and pressure for the futures to decline and eventually reach august lows, which I expect. So far, I consider yesterday high as a bull trap, unless price stays above 3450 and forms at least a rectangle pattern, what would increase the odds for current downtrend to reverse. More and more expectations are for recession in America, so the global markets have discounted eventual rate cut already (i.e. american bond market).

Tuesday, November 20, 2007

20/11/2007

Futures analysis
In the daily timeframe today's action in the futures ended up as a hammer, which confirmed short term bottom, that I was expecting lately. The market has another chance to recover and will probably reach the nearest declining moving average (10-day in this case). Moreover, today's daily candle is so called wide-ranging-day, which is a common indicator of trend reversal. The price exceeded two previous highs, so there might be a chance to see this market at least staying in recently developed range between 3450 and 3570 for little longer than three days, before the week ends. Still there is a lot of volatility in the markets, caused by unexpected macroeconomical data (today's housing starts for example) and also by betting on upcoming December Fed decision.
In the 5-minute timeframe we can see, that the futures have entered a significant short term resistance zone, which in my opinion has become more of a turning point for this market now. That is because getting above 3576 (23,6% Fibonacci retracement) will indicate more strength of the buying side and probably drive the price back to reach the 38,2% retracement, corresponding with prior support/resistance areas. The close in the U.S. is positive, so the odds for tommorrow are rather against the bears. As for mid term action, I do not think that Fed decision to cut the rates would even be a catalyst for a global reversal. Inflationary pressures are high and will improve with eventual cut, because that will weaken the dollar even more and drive commodity prices higher, so we might only see a short term euphoric buying in stock markets and then returning to downtrends on inflation concerns. Leaving the rates unchanged will reduce concerns, but rise those about recession. Either way, my stance remains as before - retest of the august lows.

Monday, November 19, 2007

19/11/2007

Futures analysis
Two days of indecision in the futures imply exactly what I said previously: we have a short term bottom. At the time of writing, the Dow is declining more than 200 points on 'sell' recommendations for Citigroup, so if the situation remains this way, tommorow we can expect a retest of 3450. Also, there will be news on housing starts and building permits, which is to determine expectations for december Fed decision. Now, the futures are entering major support zone, that is supposed to slow this declining market, at least in the short term. Today we saw a higher low in the daily timeframe as little evidence of buying, which was fueled by rising open interest. All of the moving averages have downslope now, so current downtrend is unlikely to reverse.
Daily timeframe indicates indecision and short term slowdown, but intraday data shows practically opposite situation. As the latest decline finally ended and posted a single day correction, the market pulled back only to 38,2% Fibonacci retracement and started to make lower highs from there. Even downside spikes, that occurred late in the day (implying reversal) might be overlapped tommorow, if America continues to decline. Mid term picture remains the same - the market is still prone to retest august lows.

Saturday, November 17, 2007

16/11/2007

Futures analysis
Today's session posted a doji bar in daily timeframe, suggesting short term bottom may be forming. The price reached 3453, which is actually prior support level from may and september, as you can see on the chart. We are currently entering another support zone that is theoretically supposed to slow this market. Though I expect a slowdown in the short term only, because of ultimate price target for the futures, that is - august lows (forecast from measured move, check out yesterday analysis). Unless something 'better-than-expected' happens, the global markets are rather meant to decline on weak macroeconomical data coming from the United States. Rising commodity prices spur inflation, which will cause consumers to reduce spending for consumption and eventually drive the economy into recession.
The bad thing about today's session is that selling occurred late in the day, not initially. That puts more pressure to the downside obviously, but nonetheless, increased volatility, causing fast and sharp moves may imply forming of a short term bottom. At least, in relation to previous two-day action, that took place on 9th and 12th of november, this is similar pattern. The open interest flattened for a short period, indicating indecision, which is also parallel to previous case. As for now, there is little evidence of actual buying and situation will remain this way, as long as the market stays below its nearest short term resistance - 3543, plotted on the 5-minute chart. Don't try to pick a bottom here. Wait for some confirmation, such as higher lows, or retests of 3543 level. That will indicate upside potential.

Thursday, November 15, 2007

15/11/2007

Futures analysis
Another day of decline in the futures. This time, the price fell over 2% in relation to yesterday's close. Weak pullback suggested, that this market is not stopping yet and current sharp decline will extend probably to reach august lows, as plotted on the daily chart. Though, short term support levels, which I outlined yesterday, remain the same - mid-term price target changed. The global markets are declining, because of weak macroeconomical data coming from the United States indicating slowing economy and that is basically what are we going to see in the upcoming weeks. It is actually a delayed reaction of stock markets for rallying commodity prices, that create inflationary pressures.
5-minute timeframe tells, that previous important geometrical level was broken - 76,4% retracement. Now, that there is no significant support, the market is on the way down to reach the initial rally point of 3440. The only barrier to break is the intraday low of 3477. As Dow futures went -1% today, it is questionable whether the market is going to surpass 3440 tommorrow, because of large chunk of today's american decline has already been priced. Notice, that the open interest is still falling, which means money is coming out of the market, so we have not actually witnessed opening of new short positions yet. The declining prices are fueled by quitting of the long side.

Wednesday, November 14, 2007

14/11/2007

Futures analysis
Today we had another decline in the futures. The market gapped up in the morning as a result of yesterday action in the United States, but then it erased nearly all of yesterday's gains. Resistance, that I pointed out yesterday (3640) was actually violated from the upside today, but eventually remained as such, judging by the price action, late in the trading session. Moreover, intraday high of 3667 established at another resistance, creating an actual area, which the price will have difficulties to break (3640-3670). The nearest support level for the daily timeframe would probably be the 61,8% Fibonacci retracement of this August-October rally, which corresponds with some prior support from April. If that fails, then the emergency level, would definitely be the 76,4% retracement, which also corresponds with prior support, but from September. These are the potential levels, that might cause some people to stop selling. It does not mean, they will prove as support for sure. Look for evidence of buying in the lower timeframes.
In the 5-minute timeframe, today's price action posted a typical ABC correction of prior rally. Intraday high corresponds with prior support level near 23,6% Fibonacci retracement, which is plotted on the chart and became short term resistance. That rather favours further declines in this market, meaning that we are probably going to see another retest of 3554 support tommorrow. The more a particular support/resistance is tested, the more it is likely to fail, so expect another long squeeze below that level. The open interest still has not recovered, nor even flattened, so we still have massive long exiting, driving this market lower.

Tuesday, November 13, 2007

13/11/2007

Futures analysis
Finally we have reaction in this market. Today's session was definitely influenced by american indexes, which rallied on better-than-estimated earnings report of Wal-Mart. Yesterday's inverted hammer proved to be a reversal candle and the price retraced back even above friday's close, so after a sharp decline, we have got a sharp pullback, which will probably extend at least in tommorrow morning, because part of american rally has not been priced yet. The market retested from the downside the latest significant level of support in daily timeframe, which is 3645 obviously. This is definitely a turning point as for the short term and tommorrow's action will show, whether it is going to remain as resistance or not.
Intraday triple bottom was confirmed today, so 76,4% Fibonacci retracement remained as this significant level of short term support. The futures retraced back part of the last two-day 'exhaustion decline' as I call it, but found resistance at 61,8% retracement with flattened open interest (indicating rather indecision than actual return of the buying force). Now, the question remains: is this market strong enough to pull back to at least 3700, because such action could trigger mid term bottom to form itself and increase the odds for reversal. Remember, that the moving averages and Fibonacci levels are potential levels of support, which means that it is not yet safe to buy there. So do not try to pick a bottom in such sharp declining market, wait for the evidence of buying, by checking lower timeframes.

Monday, November 12, 2007

12/11/2007

Futures analysis
In the daily timeframe, the futures posted today an inverted hammer near yesterday selloff's low. The open interest is still declining with higher than average volume, so clearly this sharp decline continues with little chances of pulling back in the short term. Although an inverted hammer candle indicates a potential reversal in the market, today's action in the American indexes puts up rather contrary stance for tommorrow. On the daily chart I plotted some levels of support of similar significance. Two previous from early and mid october have already been broken by the price, which initially started this bear market. The nearest downside target will probably be the 3420 area, which is a support of even more significance.
5-minute timeframe shows a short term triple bottom, that formed in the past two days, but that does not indicate a reversal yet. Moreover, the price fell to 76,4% Fibonacci retracement and closed actually below it, showing even more weakness with potential to retest 3440, where the rally started. Open interest declines along with the price, beating the remaining bulls and posting still lower highs. The only reasons that support the buyside are following:

  • The decline has already made three downside overnight gaps, indicating that the price is exhausted
  • Market stopped at significant geometrical level, which in conjunction with above, might suggest at least that this sharp decline should slow down

UPDATE: The Dow futures closed as an inverted hammer also, with a 0.44 decline today, so it may indicate, that we are slowing down.

Friday, November 9, 2007

09/11/2007

Futures analysis
The futures sold off again today. Long shadow on the daily chart indicates a possible short term bottom forming, but monday action will strictly depend on the close in America, which is again highly negative (-200 points in Dow Jones). Also, have in mind, that the slowing american economy might finally cause crude oil price to decline, as lower consumer income will decrease overall demand for gas. Nearest downside target in weekly timeframe for crude oil is around 80$ a barrel, which might push the stock markets up. Now we have to wait and see whether WIG20 futures are yet strong enough to even pullback and reach this broken 100-day moving average, because then we will be able to determine the condition of this market (how bearish it actually may become).
Intraday data shows how hard is to pick a bottom in this market. Though late in the day, bulls came back for a while and drove the price above 3600 on the close. The futures bounced off of the 76,4% retracement of initial extended rally, which eventually drove them to reach new historical highs. Yesterday I thought, that the price was exhausted and that we already have a chance to see actual pullback or at least short term bottom, but nothing of that happened and in the wake of still growing credit concerns, the futures might find more room to decline further.

Thursday, November 8, 2007

08/11/2007

Futures analysis
Expect the unexpected - this is probably the best way to describe latest market behavior, which posted another downside gap and ended up forming a hammer candle in the daily timeframe. I am starting to get more confident about what I wrote couple of days ago. What we see, is a delayed reaction on rallying commodity prices, mostly driven by crude oil, gold and silver - the best bets for inflationary times. The futures have formed a double top as historical peak and today's session apparently proved as its confirmation. I was worried about this market getting below the long term moving averages, but it seems that the selloff gained some strength, fueled by constantly rising volume and declining open interest (stop losses). Basically the daily timeframe now shows somewhat of a polarity in this market and that unfortunately fuels the whole concern about whether this situation will turn into bear market or not.
5-minute timeframe apparently shows opposite situation, at least for the short term. Today we had third in a row downside gap, which usually signals price exhaustion, meaning that the decline is over and about to reverse. The price ended up in much wider support zone, than I pointed out in my previous analysis. First of all, the 3700 level is broken, meaning more weakness in the market than I primarily expected. Of course, there was a retest of this level, but from the downside, because of the overnight gap. Considering another selloff, that is going on in America, it is too hard to judge really, where to pick a bottom in this market. Only reason supporting at least a stall (not yet a reversal) is that american index futures posted intraday double bottom patterns late in the trading session. That would be the setup for tommorrow and beyond probably, if nothing unexpected is about to happen overnight.