Sunday, March 30, 2008

30/03/2008

Futures analysis
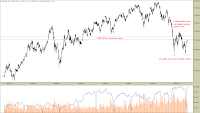
The market retraced back to the main long term resistance area between 3000 and 3075. The last session from Friday posted a hanging man, exactly touching the lower band of this crucial zone. If that is confirmed on Monday, it will reject double bottom pattern, that has developed over the past few weeks and will indicate continuation of the long term downtrend. The odds favour bears, because of negative close of american stock indexes (Friday's session). If market's opinion is changed, it will drive the price back above 3000 and then 3070, then I would look for current pullback to extend here at least to retest the February peak.
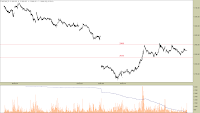
Intraday chart shows, that the futures formed kind of two separate trading ranges and established key short term resistance and support points. You can also see, that actual buying phase took place late in Friday's session. That would be the main reason, if the daily hanging man is rejected. Price managed to close above 2980, which is inside the upper consolidation range. Nonetheless I retain my bearish view for Monday. There are two reasons for that, coming just out of the intraday chart (excluding market sentiment caused by negative close in the States and daily timeframe patterns). Firstly, the futures have recently formed a double top pattern at 3015 with an upside spike bull trap, which still remains confirmed. Secondly, this whole late action, that drove the futures back above 2980 was preceded by a long upside spike, that remained unrejected by Friday's close. Now, in conjunction with the market sentiment and daily patterns, this appears to be just another bull trap, which soaked some sidelined money in and acts as a good setup point for eventual shorts. Unless this Friday's late double top pattern is rejected on monday (by an upthrust candle for instance), the futures remain in downtrend.

Saturday, March 22, 2008

22/03/2008

Futures analysis
Back on track with new motherboard after almost three weeks of waiting. And it so happened, that my analysis will be the last of the March futures contracts, as they expired. From now on, we will move on to June series. My last analysis covered price action, that took place yet inside of a descending triangle formation, which was broken just one day before I had to service my computer. I stated, that if the futures get back below 3000 level, then it will definitely mean downtrend continuation. The market only managed to pull back a little to find resistance between the declining 10- and 20-day moving averages, which is a natural corrective pattern. We also had an attempt to retest January low, but the price eventually stalled little higher, than the actual low. Fed has lowered interest rates to 2.25, causing some bullish volatility, but as you can see on the daily chart, so far the futures have not been able to retrace back above the moving averages. Moreover, the last two trading sessions posted a doji and an inside bar inverted hammer, indicating short term level of resistance near 2890 and current pullback's end.
I will cover only the latest price action in the intraday section, as I was not able to do an up-to-date analysis. Anyway, if previously established key intraday points are yet to play a significant role in case of extended uptrend, I will point that out. Now, as you can see, the futures became range-bound between 2900 and 2835, which in the wake of short term upside action acts just as a corrective/consolidation pattern suggesting continuation. It also contradicts with daily patterns, that I described as reversal-indicating (doji and inverted hammer). We have to wait for a confirmation. Doji and inverted hammer will become rejected if price comes back above 2900 with a sustained move (must not be a bull trap). On the other hand, they will be confirmed, if the futures break through 2835, which must eventualy become resistance. Breaking through either side leaves relatively little room to advance or decline. The nearest resistance in case of upside breakthrough appears to be at a point, where the last gap occurred. The nearest support in case of a breakdown lies near 2800, where the gap ends. The market has become more choppy, due to various Fed actions and news from companies, so the long term downtrend will progress much slower than earlier.

Wednesday, March 5, 2008

No analysis this week

I am sorry, but there will be no analysis, probably until the end of this week, due to my computer malfunction.

Saturday, March 1, 2008

01/03/2008

Futures analysis
The last two candles in the daily timeframe remained below the lower band of the pennant pattern and this market is ready to retest its last swing low of 2860. Volume returned again, as we have continuation of the main downtrend. Significance and strength of 2860 support level will depend on how strongly the market is convinced about projected bank losses in the U.S. If price gains enough momentum, then it could go past this support with no looking back, as it did while breaking 3340 back in January. The short term moving averages crossed over on friday, confirming downtrend continuation.
Thursday's decline occurred yet on higher volatility, as the global markets were constantly shifting due to various macroeconomical announcements from America. On friday, the futures finally gained momentum and broke through a couple of support levels on the way. Session closed, finding support at 2925. Upcoming week will bring another important news, which is the ISM index, showing condition of american economy. Intraday support levels, in case of a breakdown on monday include: 2885 and mid-term 2860, mentioned in the first section of this post.